Key Highlights
- ETH price struggled to remain above the $337 support zone against the US Dollar and moved down.
- There was a break below a key bullish trend line with support at $332 on the hourly chart of ETH/USD (data feed via SimpleFX).
- The price might continue to correct lower and could even retest the last swing low of $317.
Ethereum price is losing grip against the US Dollar and Bitcoin. ETH/USD might correct lower towards $317 in the near term since it is below $332.
Ethereum Price Support
After a successful hard fork, there was no major upside move in ETH price above $340 against the US Dollar. The price remained below the $350 level and started a downside move. Initially, there was a break below the 23.6% Fib retracement level of the last wave from the $317.31 low to $350.52 high. It opened the doors for more losses below the $340 level. During the downside, there was a break below a key bullish trend line with support at $332 on the hourly chart of ETH/USD.
The pair even broke the 50% Fib retracement level of the last wave from the $317.31 low to $350.52 high. Later, it settled below $325 and the 100 hourly simple moving average. At the moment, the price is trading just above the 76.4% Fib retracement level of the last wave from the $317.31 low to $350.52 high. Therefore, there are chances of ETH testing the last swing low of $317 once again.
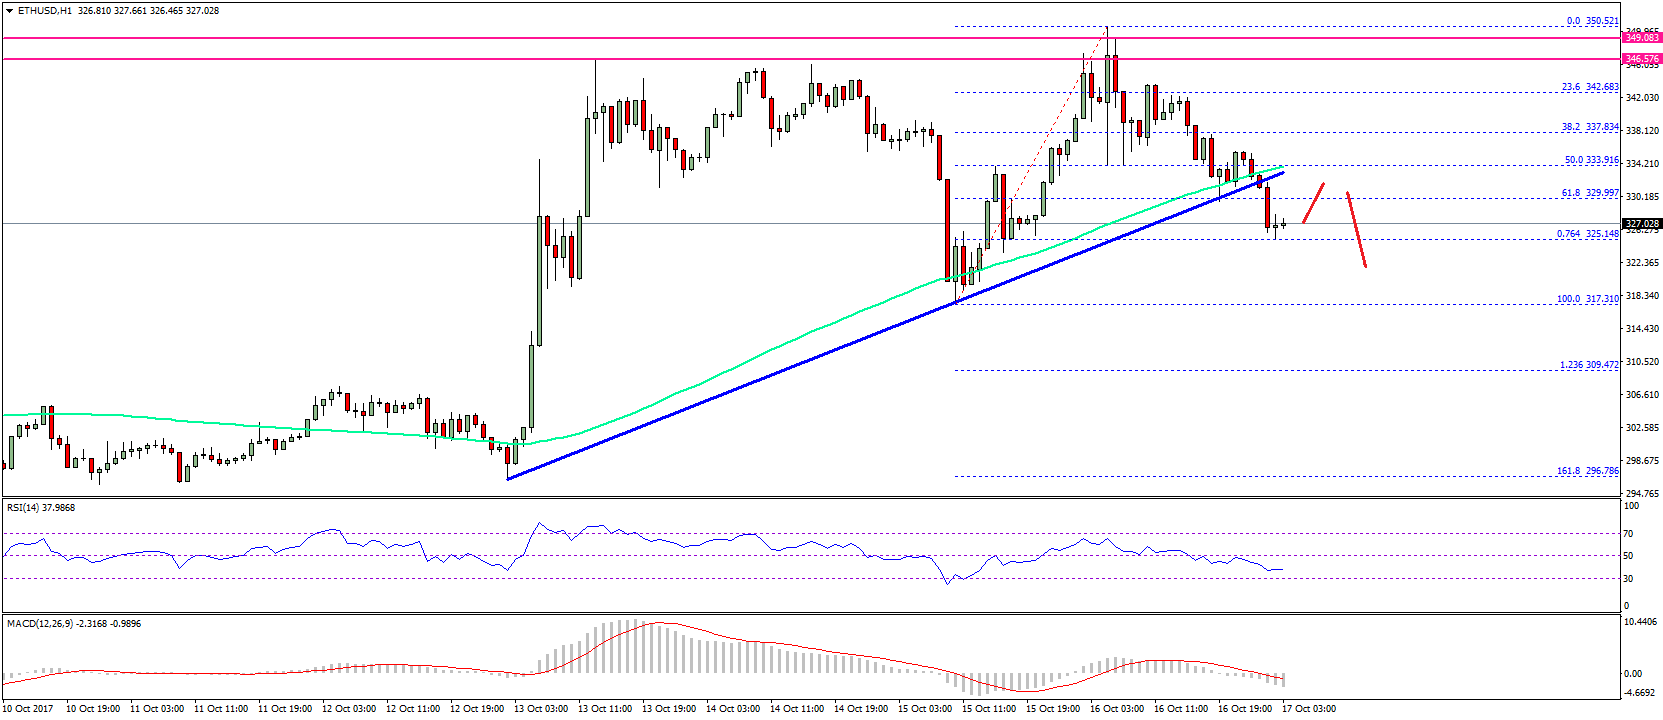
Below $317, sellers may look to take control. The price could even move toward the $308 support zone. On the upside, the broken support at $332 would now serve as a resistance along with the 100 hourly SMA.
Hourly MACD – The MACD is gaining pace in the bearish zone.
Hourly RSI – The RSI is well below the 50 level and heading lower.
Major Support Level – $317
Major Resistance Level – $332
Charts courtesy – SimpleFX