Key Highlights
- ETH price gained pace after a correction towards the $10.35 support against the US Dollar.
- This week’s highlighted connecting resistance trend line on the hourly chart of ETH/USD (data feed via SimpleFX) is still acting as a resistance near $10.65.
- The price may once again correct a few points down before making an attempt to break $10.65.
Ethereum price is back in the bullish zone after a mild correction against the US Dollar, and it looks like ETH/USD may break $10.65 soon.
Ethereum Price Resistance
There was a minor correction initiated in ETH price against the US Dollar towards $10.35. The price found support near the stated level and started to move higher once again. It looks like the price completed a correction since the bounce was from the 61.8% Fib retracement level of the last wave from the $10.25 low to $10.52 high. During the upside move, the price broke the $10.40 resistance.
Moreover, there was a break above yesterday’s highlighted bearish trend line on the hourly chart of ETH/USD (data feed via SimpleFX) at $10.45. However, the upside move was stalled near this week’s highlighted connecting resistance trend line on the same chart at $10.65. The price struggled to clear it, and once again moved down to correct lower. It is testing the 23.6% Fib retracement level of the last wave from the $10.25 low to $10.65 high, which is a support.
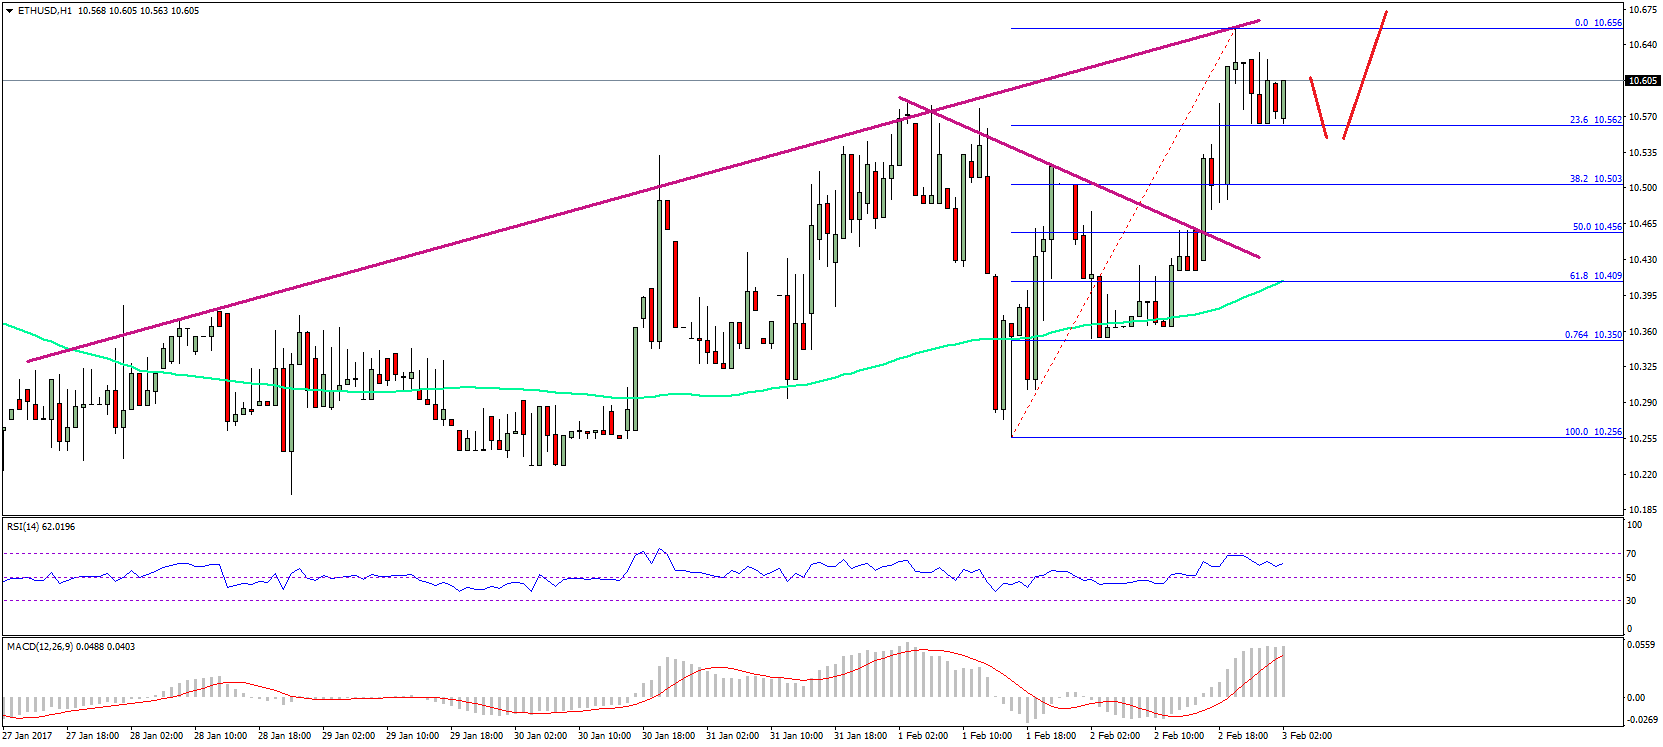
If there is an extension of the correction, then the $10.45 support may be tested. Moreover, the 38.2% Fib retracement level of the last wave from the $10.25 low to $10.65 high might also act as a support at $10.50. In short, the price may find support and could make an attempt to break $10.65.
Hourly MACD – The MACD is placed well in the bullish zone.
Hourly RSI – The RSI is well above the 50 level, and remains supported.
Major Support Level – $10.45
Major Resistance Level – $10.65
Charts courtesy – SimpleFX