Key Highlights
- ETH price maintained its bullish bias and managed to trade as high as $30.84 recently.
- Yesterday’s highlighted two bullish trend lines on the hourly chart (ETH/USD, data feed via SimpleFX) remains intact and likely to act as a support near $25.20.
- The pair seems to be correcting lower at present, and already tested $25 once.
Ethereum price upside ride continues against the US Dollar, as there was a push above $30 before ETH/USD started a minor correction.
Ethereum Price Support Areas
There was a crushing upside move in ETH price, as it moved above several resistances against the US Dollar. The best part was a move above the $30 level. However, the price was offered briefly, which started a correction below $30. The price started moving down after trading as high as $30.84. It cracked the 23.6% Fib retracement level of the last wave from the $21.35 low to $30.84 high. However, the correction extended and the price was seen trading below $28.00.
There was even a test of the 61.8% Fib retracement level of the last wave from the $21.35 low to $30.84 high. The price traded as low as $25.04 before it started moving back higher. The price traded back towards the $28.80 level where it once again faced sellers. It is in another downside wave and might soon find support. On the downside, yesterday’s highlighted two bullish trend lines on the hourly chart of ETH/USD (data feed via SimpleFX) are active near $25.20.
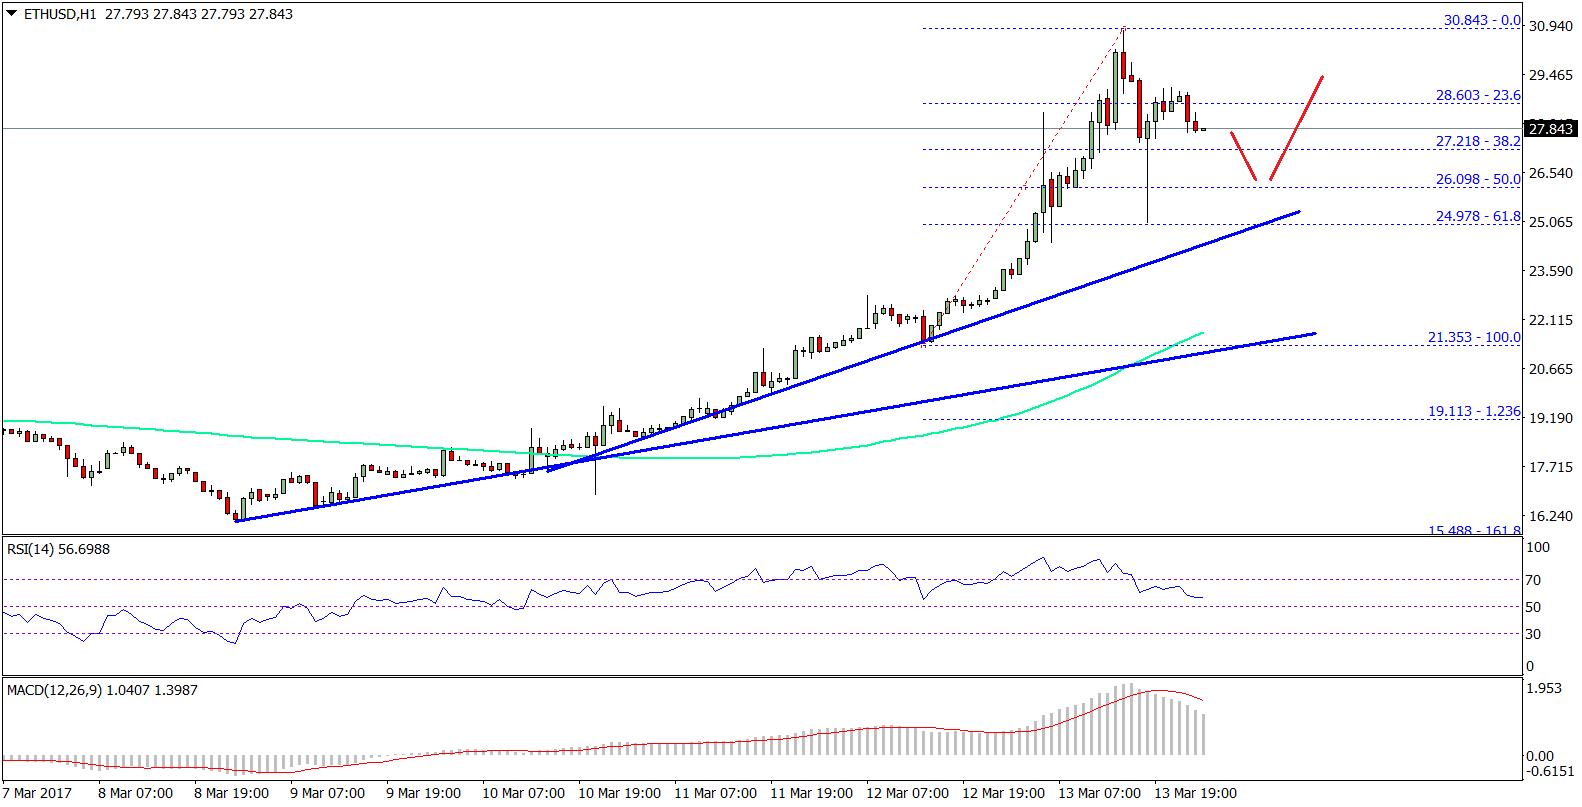
So, if the price moves down, it might find buyers near 25.00. There are many other support levels on the downside like $24.40 and $23.0. Any major dip might be considered as a buying opportunity in the near term.
Hourly MACD – The MACD is just moving down in the bullish zone.
Hourly RSI – The RSI is retreating and heading towards the 50 level.
Major Support Level – $25.10
Major Resistance Level – $29.40
Charts courtesy – SimpleFX