Key Highlights
- ETH price retained the bullish bias, and managed to stay above the $40 support level against the US Dollar.
- There is a contracting triangle pattern formed with support near $40.80 on the hourly chart (ETH/USD, data feed via SimpleFX).
- On the upside, the triangle resistance is at $48.80, acting as a hurdle for more gains.
Ethereum price remained elevated against the US Dollar, and it looks like ETH/USD has a nice support formed just around the $40.50 level.
Ethereum Price Support Zone
Yesterday, there was a minor upside move ETH price against the US Dollar towards the $45 level. The price was also able to clear the 61.8% Fib retracement level of the last decline from the $49.74 high to $30.36 low. However, it failed to break the 76.4% Fib level of the same wave just around $45. As a result, there was a downside move towards the $40.00 handle. The price traded as low as $39.65 where it found support.
During the downside move, there was a break below the 23.6% Fib retracement level of the last wave from the $30.36 low to $45.03 high. Later, it found support near the 38.2% Fib level at $39.42, and recovered. At the moment, the price is trading positively above $40.50. There is a contracting triangle pattern formed with support near $40.80 on the hourly chart (ETH/USD, data feed via SimpleFX). It is acting as a supportive pattern, and may produce a bounce from $40.50.
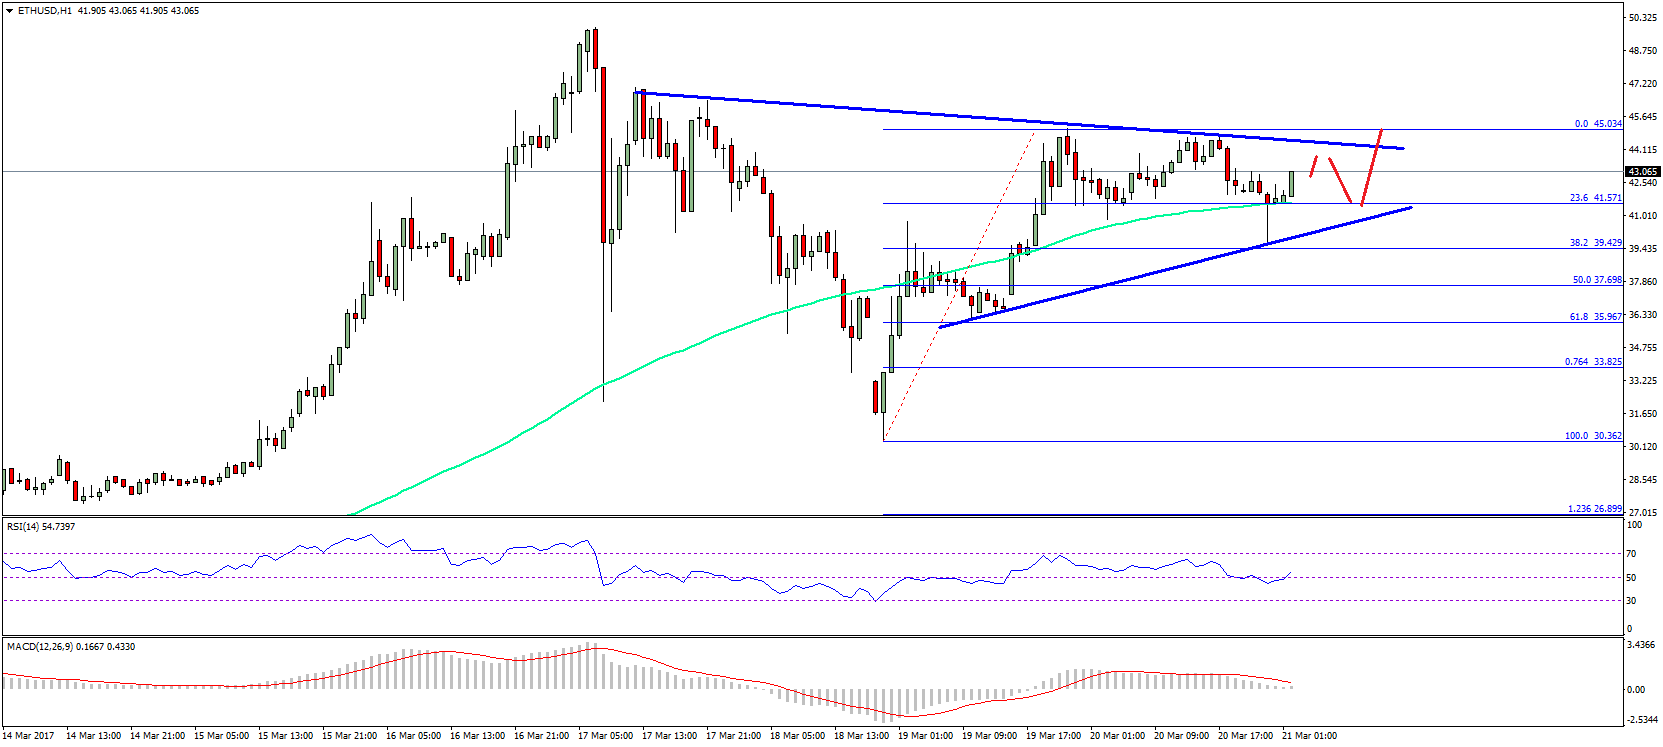
On the upside, the price needs to clear the triangle resistance at $44.80 in order for a push higher. More importantly, the price also needs to break the $45.06 level for a sustained move higher.
Hourly MACD – The MACD is struggling to gain momentum in the bullish area.
Hourly RSI – The RSI has just moved above the 50 level, and showing positive signs.
Major Support Level – $40.50
Major Resistance Level – $44.80
Charts courtesy – SimpleFX