Key Highlights
- ETH price remained below the $308-310 resistance against the US Dollar.
- There is a connecting bearish trend line with resistance at $308 forming on the hourly chart of ETH/USD (data feed via SimpleFX).
- There pair is move to and fro between $290-308 before making the next move in the near term.
Ethereum price remains elevated against the US Dollar and Bitcoin, and ETH/USD might trading in a range above $290 before making the next move.
Ethereum Price Resistance
Recently, there was an upside move towards $308 in ETH price against the US Dollar. The price traded as high as $308.61 where it faced sellers and moved down. During the downside move, it broke a bullish trend line with support at $301.14 on the hourly chart. There was even a break below the 23.6% Fib retracement level of the last wave from the $276.83 low to $308.61 high.
However, the downside move was protected by the 38.2% Fib retracement level of the last wave from the $276.83 low to $308.61 high. The price is now once again moving higher towards the $308 resistance. There is a connecting bearish trend line with resistance at $308 forming on the hourly chart of ETH/USD. This trend line may prevent gains above $310 one more time. In the mentioned case, there could be a retest of the $300-295 area before the price resumes its uptrend.
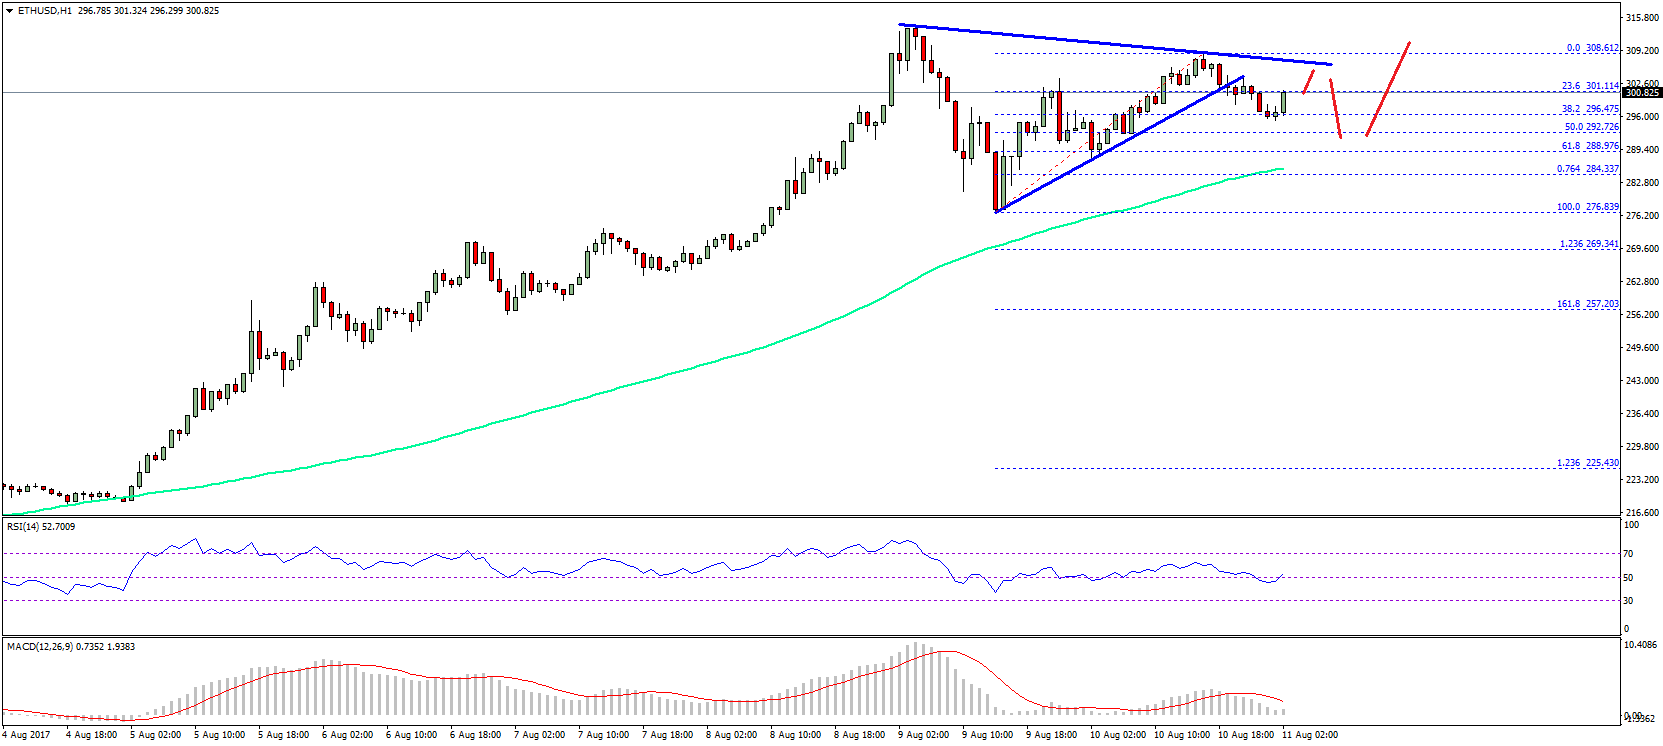
On the downside, the 50% Fib retracement level of the last wave from the $276.83 low to $308.61 high is a good support at $292.72. Buying dips towards the $292 support and the 100 hourly simple moving average can be considered in the near term.
Hourly MACD – The MACD is reducing its bullish slope and may move into the bearish zone.
Hourly RSI – The RSI is attempting to settle above 50 level, which is a positive sign.
Major Support Level – $292
Major Resistance Level – $308
Charts courtesy – SimpleFX