Key Highlights
- ETH price surged higher and broke the $188 level against the US Dollar to trade towards $255.
- There is a major bullish trend line with support at $202 forming on the hourly chart of ETH/USD (data feed via SimpleFX) was broken.
- The price is currently correcting lower, but remains supported above $200 in the near term.
Ethereum price rocketed higher against the US Dollar and Bitcoin, and the ETH/USD pair is currently correcting lower towards $210-200 after the recent rally.
Ethereum Price Correction
Recently, there was a solid upside move in ETH price above the $188 resistance against the US Dollar. The price broke the $190 level and traded easily above the $200 handle. The upside move was sharp, as buyers took out the 61.8% Fib retracement level of the last decline from the $223.35 high to $136.55 low. They even succeeded in clearing the last swing high of $223 and took the price towards $225.
A weekly high was formed at $255.74 from where a correction wave started. At the moment, the price is trading below the 23.6% Fib retracement level of the last wave from the $136.51 low to $255.74 high. However, there is a major bullish trend line with support at $202 forming on the hourly chart of ETH/USD. It may act as a crucial support above $200.00. Furthermore, the 38.2% Fib retracement level of the last wave from the $136.51 low to $255.74 high might also provide support at $210.
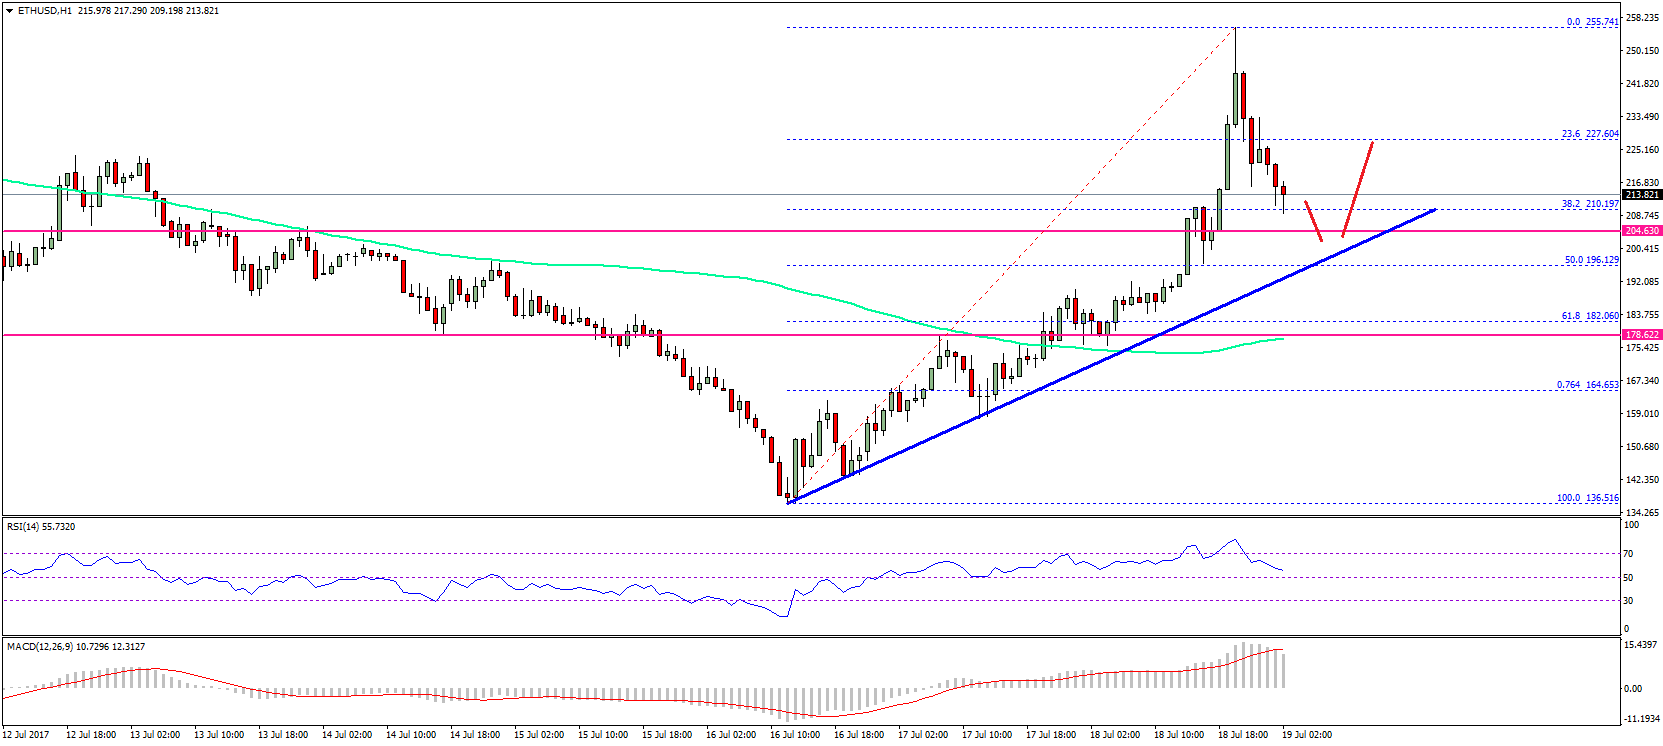
It looks like the price is back in the bullish zone, and could trade back higher. On the upside, a break above $225 is needed for a retest of $250. Above $250, the price may target the $280 area.
Hourly MACD – The MACD is now solidly placed in the bullish zone.
Hourly RSI – The RSI is moving lower towards the 50 level.
Major Support Level – $210
Major Resistance Level – $225
Charts courtesy – SimpleFX