Key Highlights
- ETH price after a minor correction against the US Dollar towards $10.88 found support.
- Yesterday’s highlighted descending channel pattern on the hourly chart of ETH/USD (data feed via SimpleFX) was broken at $11.05 for an upside move.
- Now, an ascending channel pattern is formed with support at $11.10.
Ethereum price likely completed a correction wave against the US Dollar, and ETH/USD might now trade back towards the last high of $11.30.
Ethereum Price Support
Yesterday, we saw how there was a correction wave initiated in ETH price against the US Dollar towards $11.00. The price broke the $11.00 handle and traded as low as $10.88 where it found support and started to move back higher. The best part was the rejection near the 38.2% Fib retracement level of the last wave from the $10.41 low to $11.22 high. Moreover, there was a break above yesterday’s highlighted descending channel pattern on the hourly chart of ETH/USD (data feed via SimpleFX) at $11.05.
So, we can say that the price completed a correction wave near $10.88, and likely to trade back higher. It has already broke the 50% Fib retracement level of the last decline from the $11.22 high to $10.88 low. It means there is a chance of a full test of $11.22. If the ETH buyers remain in action, the price could even test the 1.236 extension of the last decline from the $11.22 high to $10.88 low at $11.30.
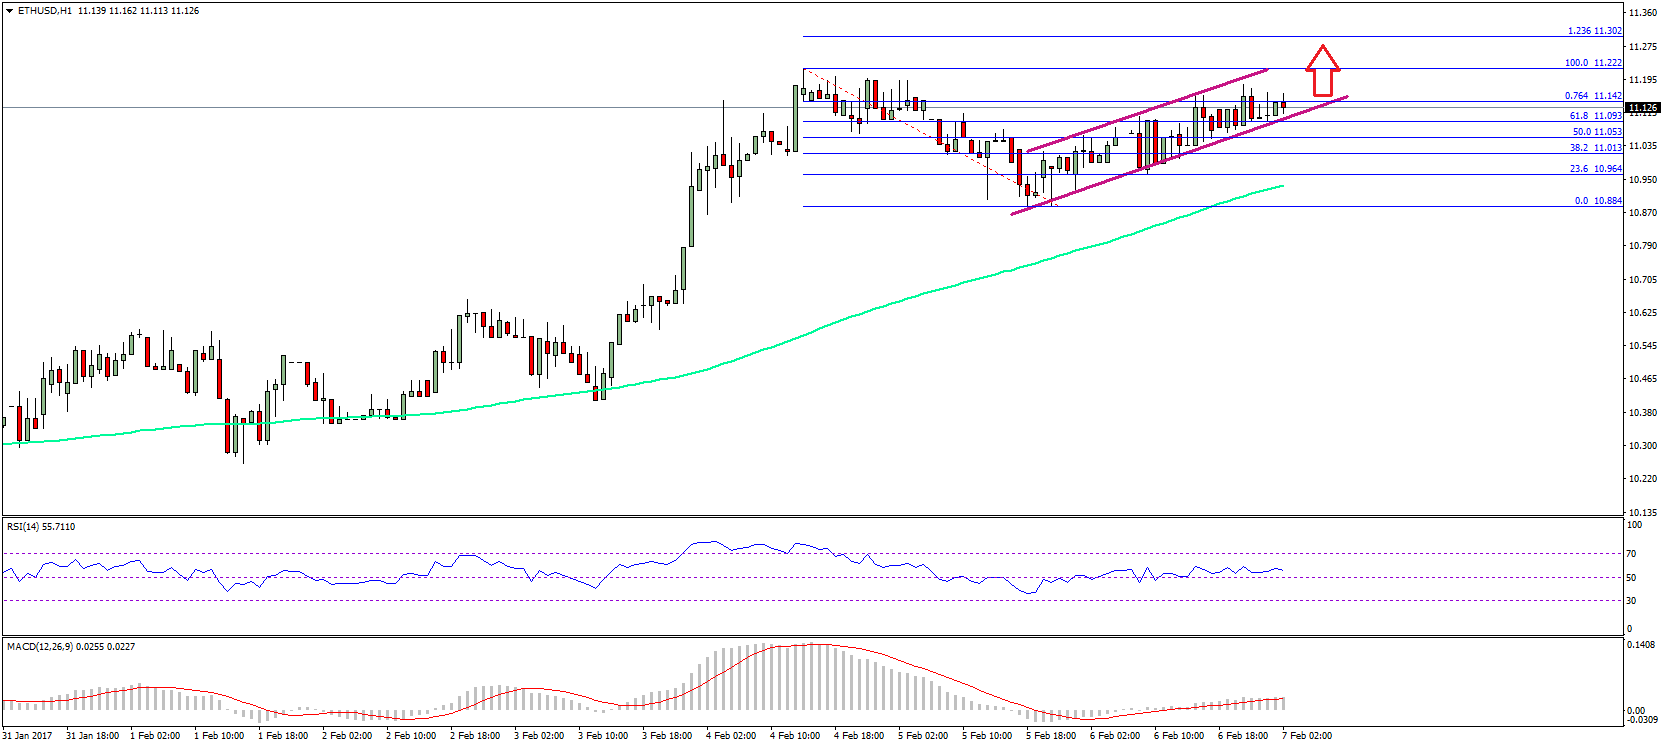
There is now an ascending channel pattern formed on the same chart with support at $11.10. So, the price is likely to trade higher and move towards $11.25-11.30. Any further gains may depend upon the market sentiment.
Hourly MACD – The MACD is back in the bullish slope, which is a positive sign
Hourly RSI – The RSI has settled above the 50 level, and currently stable.
Major Support Level – $11.10
Major Resistance Level – $11.30
Charts courtesy – SimpleFX