Key Highlights
- ETH price started a minor correction from the $337.65 swing high against the US Dollar.
- There was a break below yesterday’s highlighted major bullish trend line with support at $326.50 on the hourly chart of ETH/USD (data feed via SimpleFX).
- The price tested the $318 support area where appeared and protected further declines.
Ethereum price moved a few points down against the US Dollar and Bitcoin. ETH/USD is currently above $326 and facing hurdles on the upside.
Ethereum Price Resistance
There was no major move above the $336-337 resistance in ETH price against the US Dollar. The price started a downside move and traded below the 38.2% Fib retracement level of the last wave from the $306.73 low to $337.65 high. More importantly, there was a break below yesterday’s highlighted major bullish trend line with support at $326.50 on the hourly chart of ETH/USD.
It has opened the doors for further corrections as long as the price is below $336-337. The last downside wave was protected by the $318 support and the 50% Fib retracement level of the last wave from the $306.73 low to $337.65 high. Moreover, the 100 hourly simple moving average near $318.50 acted as a support and prevented declines. The pair is now moving back higher and is currently trading above $326. On the upside, there is a connecting bearish trend line with resistance at $328.50.
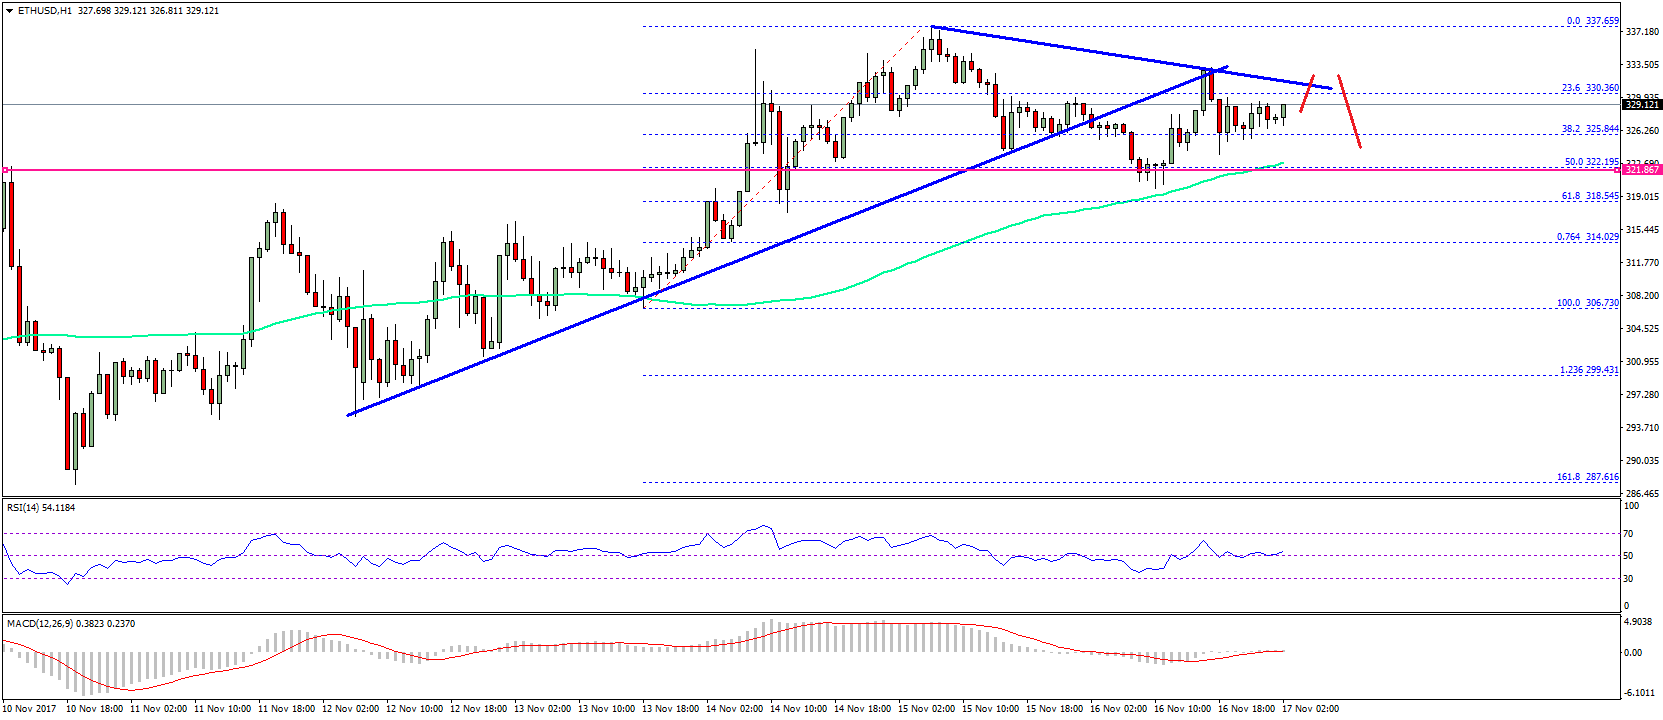
As long as the price is below the $336 and $337 levels, there is a chance of another downside move back toward $322. However, any major declines below $318 and 100 hourly simple moving average should be limited. There can be a couple of swing moves below $336 before the price attempts the next move.
Hourly MACD – The MACD is mostly flat with minor bullish signals.
Hourly RSI – The RSI is currently just above the 50 level with no major bearish signal.
Major Support Level – $318
Major Resistance Level – $337
Charts courtesy – SimpleFX