Key Highlights
- ETH price failed to remain above the $317 swing low against the US Dollar and extended its decline.
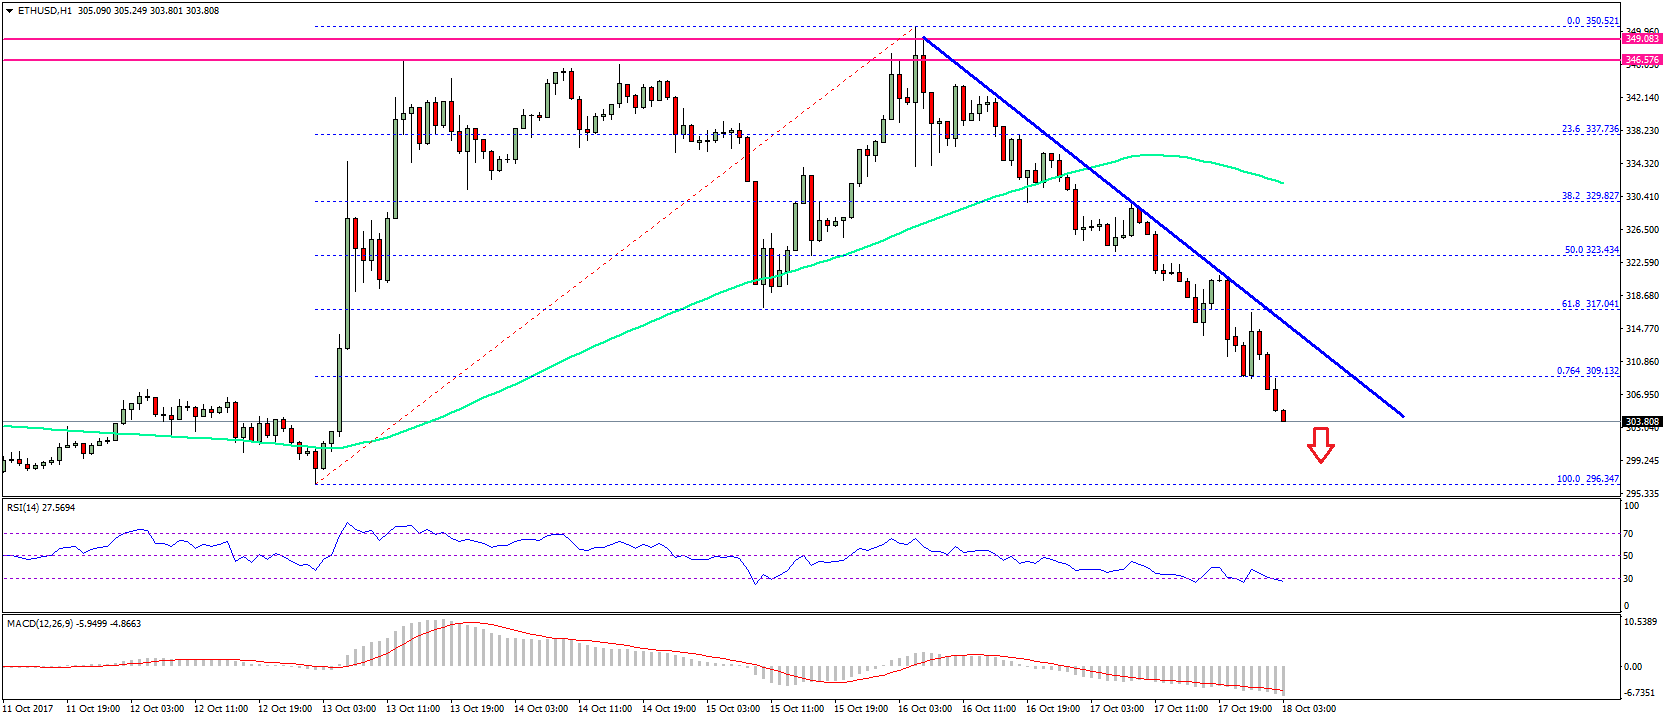
- There is a connecting bearish trend line forming with current resistance at $310 on the hourly chart of ETH/USD (data feed via SimpleFX).
- The price might continue to decline and could even test the $300.00 handle in the near term.
Ethereum price extended its decline against the US Dollar and Bitcoin. ETH/USD might slide further and could test the $300-296 support zone.
Ethereum Price Decline
Yesterday, we saw the start of a downside move in ETH price below $335 against the US Dollar. The price remained under a bearish pressure and traded below $330 and the 100 hourly simple moving average. Sellers got back in control and even took the price below the last swing low of $317. It has opened the doors for more gains since the price is now below $315. A break below the 50% Fib retracement level of the last wave from the $296.34 low to $350.52 high points to further losses.
At the moment, the price is trading below $310 and eyeing a test of the $300 level. Since, the price is already below the 76.4% Fib retracement level of the last wave from the $296.34 low to $350.52 high, there is a chance of ETH retesting $296.34. On the upside, there is a connecting bearish trend line forming with current resistance at $310 on the hourly chart of ETH/USD.
It won’t be easy for buyers to push the price back above $315-317 levels. On the downside, an immediate support is at $300 followed by the last swing low at $296.34. Selling rallies in the short term towards $315-320 can be considered with a stop above $330.
Hourly MACD – The MACD is placed well in the bearish zone.
Hourly RSI – The RSI is currently near the oversold levels.
Major Support Level – $300
Major Resistance Level – $317
Charts courtesy – SimpleFX