Key Highlights
- ETH price failed to hold an important support and traded towards $301 against the US Dollar.
- Yesterday’s highlighted short-term bullish trend line with support at $305 was broken on the hourly chart of ETH/USD (data feed via SimpleFX).
- The price is currently holding the 100 hourly simple moving average at $300.80, but remains at risk.
Ethereum price started declining once again against the US Dollar and Bitcoin. ETH/USD might extend declines toward $299 or even $297.
Ethereum Price Trend
There was no upside break in ETH price above the $309 level against the US Dollar. The price started a downside move and broke the 23.6% Fib retracement level of the last wave up from the $290.98 low to $309.08 high. The downside wave was such that the price failed to hold an important support and traded towards $301. During the downside move, there was a break below yesterday’s highlighted short-term bullish trend line with support at $305 on the hourly chart of ETH/USD.
It opened the doors more declines and the price even cracked the $302 support to test the 100 hourly simple moving average. ETH is currently holding the 100 hourly simple moving average, but remains at risk of more losses toward $299 or even $297. The next important support is near the 50% Fib retracement level of the last wave up from the $290.98 low to $309.08 high at $299.99. A close below $299.99 could ignite a downside wave towards the next support at $297.00.
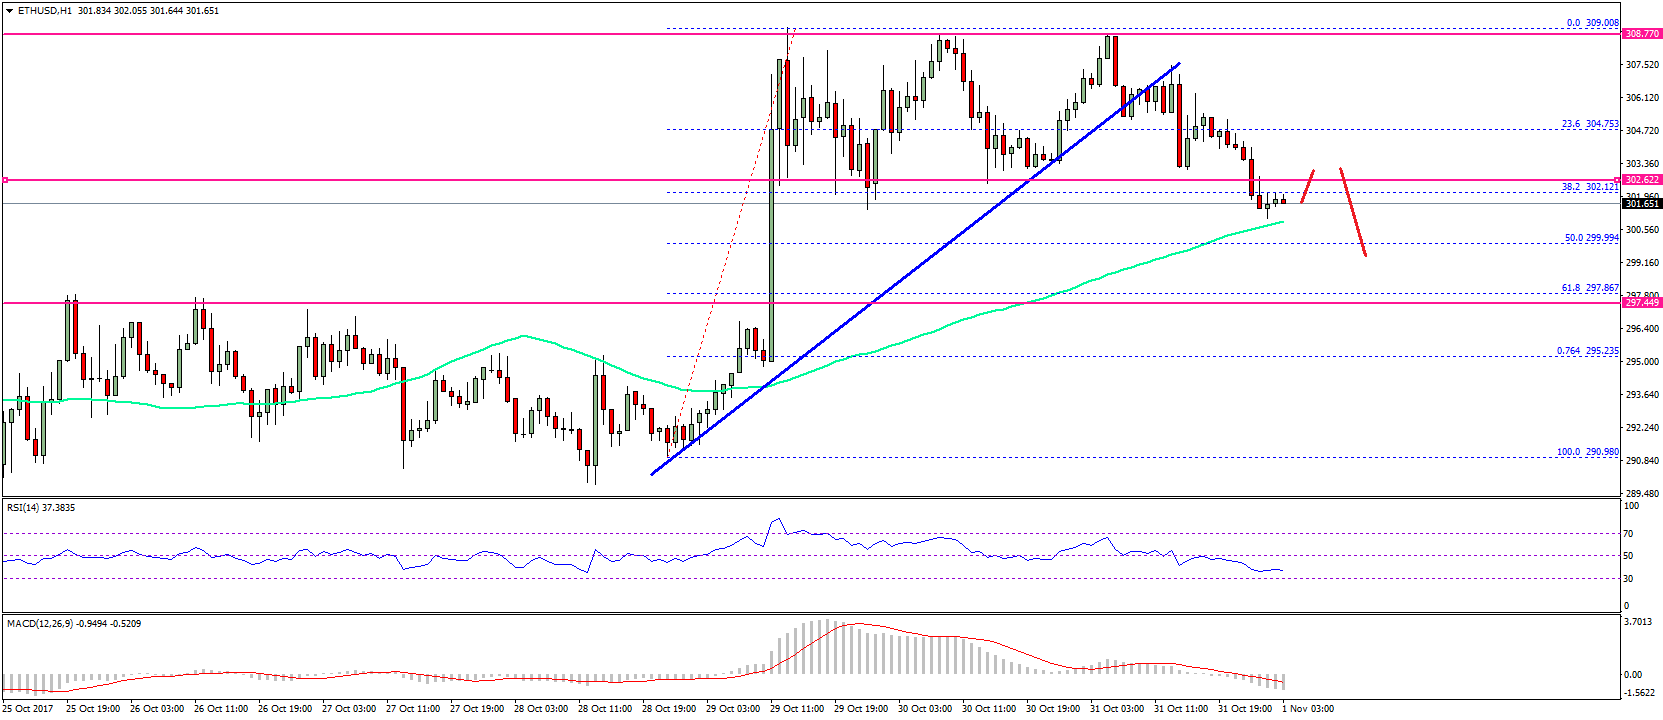
On the upside, the $305 level is now a resistance area. A close above $305 is required for a retest of $309. Overall, there can be more ranging moves below $309 before ETH/USD makes the next move.
Hourly MACD – The MACD is gaining pace in the bearish zone.
Hourly RSI – The RSI is now well below the 50 level and showing negative signs.
Major Support Level – $299
Major Resistance Level – $305
Charts courtesy – SimpleFX