Key Highlights
- ETH price failed to hold the downside move against the US Dollar, and broke the $7.85 support area.
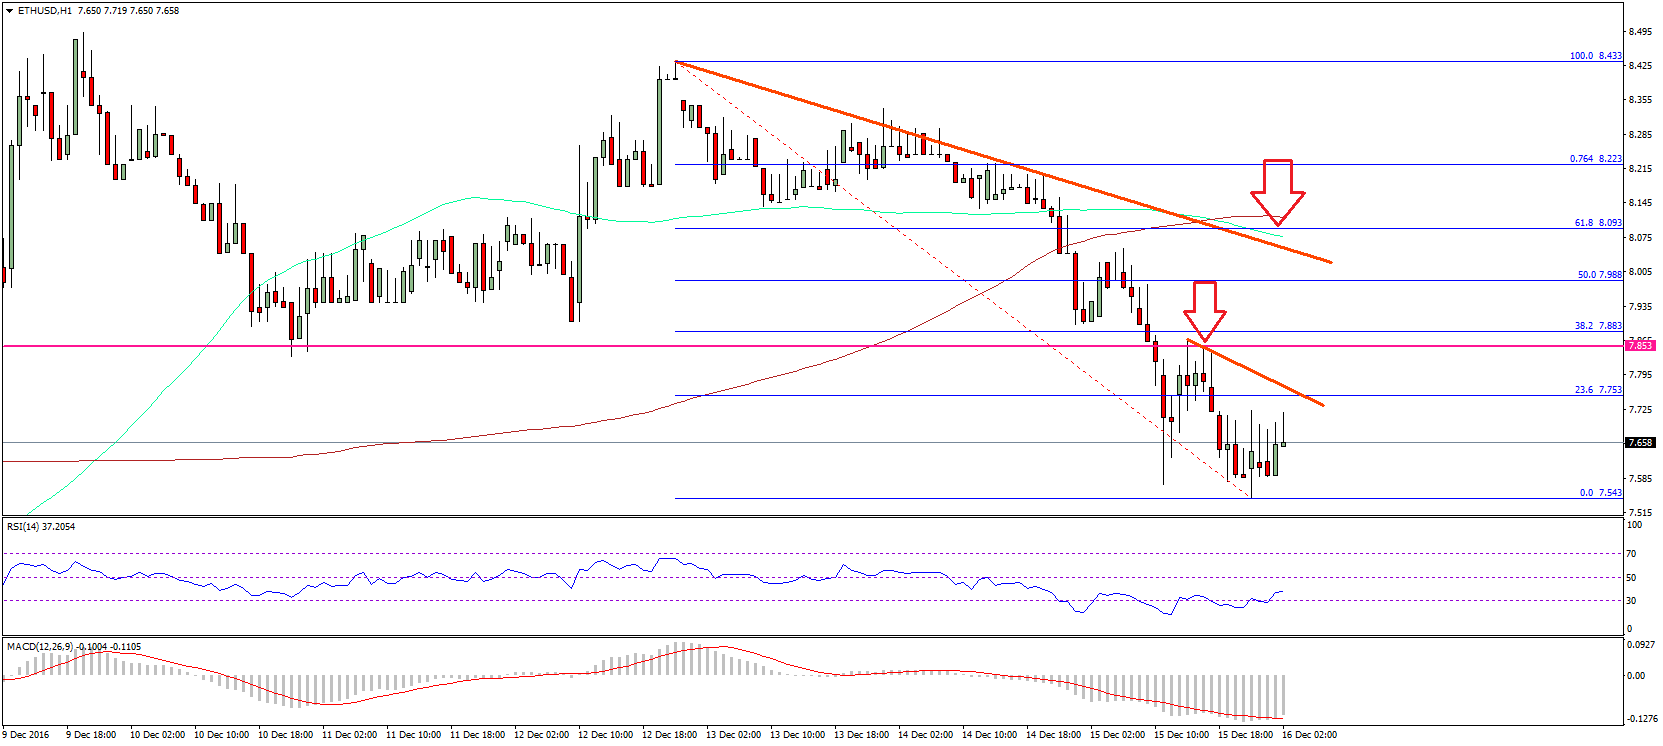
- Yesterday’s highlighted bearish trend line on the hourly chart (data feed via SimpleFX) of ETH/USD acted as a resistance and pushed the price down.
- The price traded as low as $7.54 and currently attempting a recovery.
Ethereum price extended losses against the US Dollar and Bitcoin. It looks like the ETH/USD pair may keep struggling in the short term.
Ethereum Price Resistance
There was an increase in the bearish pressure on ETH price versus the US Dollar, which ignited more losses. Yesterday, we saw how the price traded below $8.00 and attempted further declines. Now, it broke the last swing low to trade below $7.90 for a new low of $7.54. The most important aspect is the fact that yesterday’s highlighted bearish trend line on the hourly chart (data feed via SimpleFX) of ETH/USD acted as a barrier and protected gains.
Another critical point to note is that the price is now below the $7.85 support, which was a major pivot area. It may now act as a resistance and prevent gains. There is a new short-term bearish trend line formed on the same chart, which is currently acting as a resistance. Moreover, the 23.6% Fib retracement level of the last decline from the $8.43 high to $7.54 is at the moment acting as a resistance.
Overall, looking at the hourly chart of ETH/USD, it looks like the pair is below a major support area and facing many resistances. As long as it is below $7.90, the ETH sellers could attempt to take it further down may be towards $7.20.
Hourly MACD – The MACD is now in the strong bearish slope, calling for more losses.
Hourly RSI – The RSI is currently recovering from the oversold readings, but remains below the neutral level.
Major Support Level – $7.50
Major Resistance Level – $7.90
Charts courtesy – SimpleFX