Key Highlights
- ETH price made a recovery above the $12.50 level, but still facing sellers near $12.75 against the US Dollar.
- There is a clear major resistance formed near $12.75-80 on the hourly chart of ETH/USD (data feed via SimpleFX).
- On the downside, there is a connecting trend line with support at $12.58 formed.
Ethereum price recovered from yesterday’s losses against the US Dollar, bur the ETH/USD pair is still facing a major hurdle near $12.75.
Ethereum Price Resistance
We saw a downside move in ETH price towards $12.07 level against the US Dollar yesterday. Later, the price recovered, and even managed to move back above the $12.55 resistance area. There was even a move above the 50% Fib retracement level of the last decline from the $13.24 high to $12.07 low. However, the upside was limited, as the price faced sellers near the $12.75-80 resistance area.
It represents the same old range resistance around $12.75, which is clearly visible on the hourly chart of ETH/USD (data feed via SimpleFX). The price may continue to face offers near the highlighted resistance area and might test the $12.55 support. It was a major range support earlier, and may come into action one more time. There is also a connecting trend line with support at $12.58 formed on the same chart, which could act as a support.
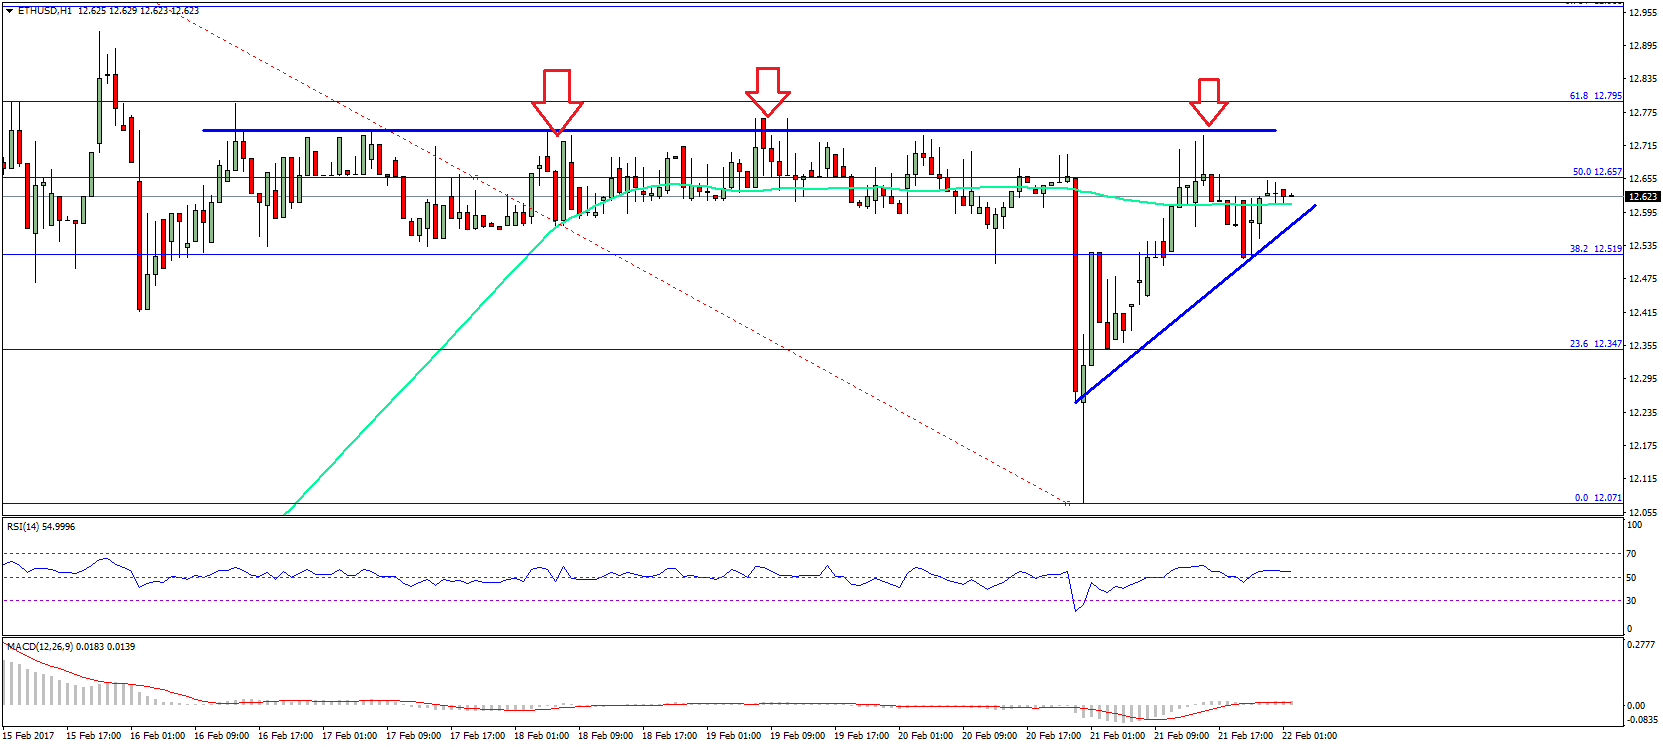
The price is now just above the 100 hourly simple moving average, but there is momentum. ETH needs to break the $12.75-12.80 resistance area to ignite further gains. If it continues to fail near the range high, there can be another downside break towards $12.40. In my view, staying on the sidelines is the best deal at the moment.
Hourly MACD – The MACD is just in the bullish zone with no momentum.
Hourly RSI – The RSI has managed to move back above the 50 level.
Major Support Level – $12.40
Major Resistance Level – $12.80
Charts courtesy – SimpleFX