Key Highlights
- ETH price managed to correct towards $19.99 where it found sellers and moved down.
- It broke a major bullish trend line with support at $19.25 on the hourly chart (ETH/USD, data feed via SimpleFX).
- The price is also below the 100 simple moving average and $19.20, which is not a good sign in the short term.
Ethereum price is currently trading lower below $19.20 against the US Dollar, and it looks like ETH/USD might extend the current downside move.
Ethereum Price Downside Break?
Yesterday, we saw a correction wave towards $19.80-90 in ETH price vs the US Dollar. The price traded as high as $19.99 where it found sellers. It also managed to break the 50% Fib retracement level of the last drop from the $20.54 high to $18.05 low. However, it failed to break the 76.4% Fib level of the same wave. It resulted in a downside move, as the price broke the $19.50 support.
During the downside move, there were two important breaks. First, a major bullish trend line with support at $19.25 on the hourly chart (ETH/USD, data feed via SimpleFX) was cleared. Second, the price settled below 100 simple moving average at $19.20. This means the price is now at a risk of a downside move. It already cleared the 38.2% Fib retracement level of the recent move from the $18.05 low to $19.99 high. If the ETH sellers manage to push the price below $19.00, there can be more declines.
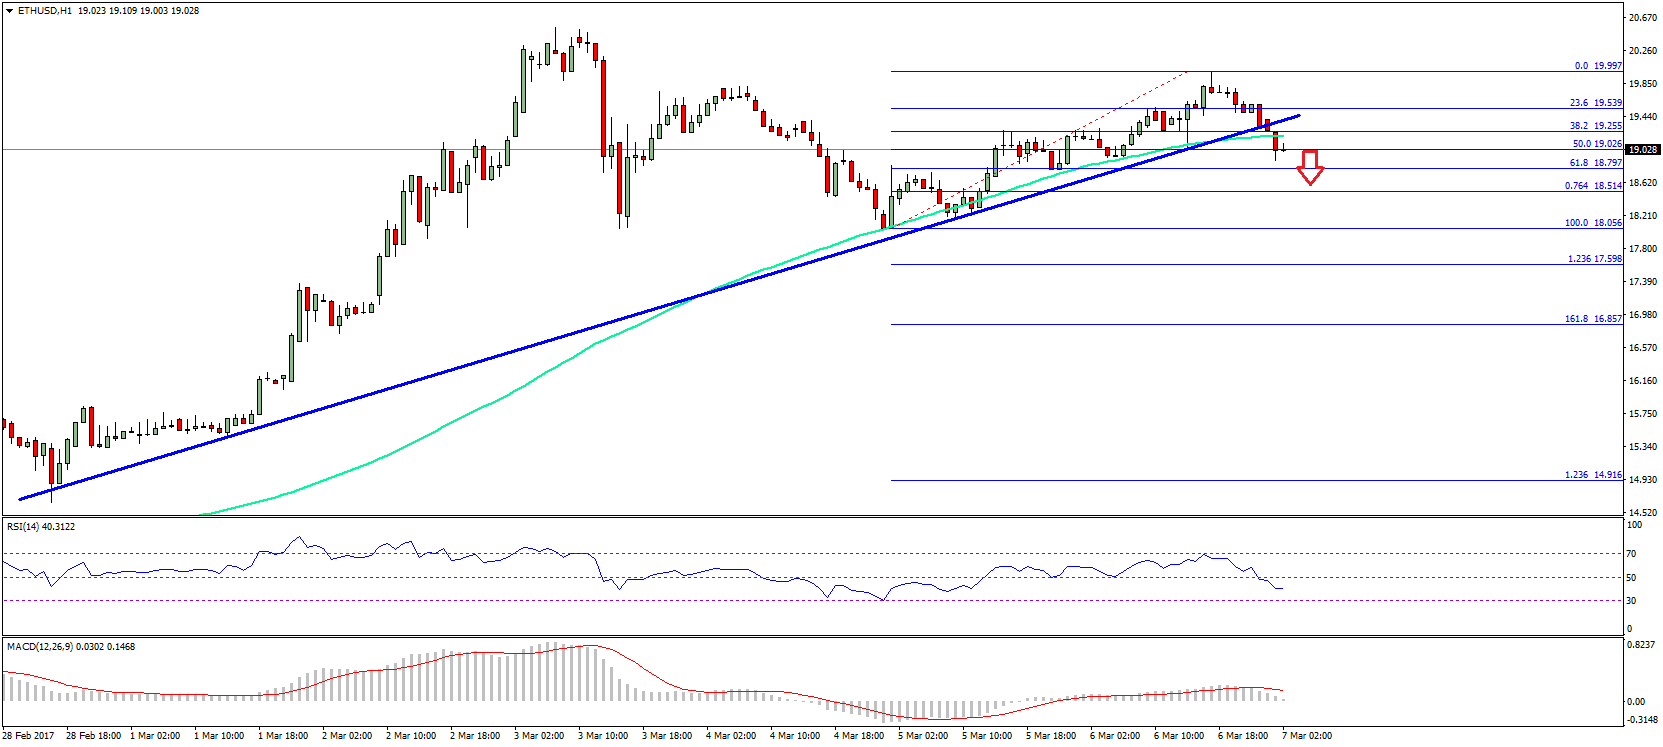
Alternatively, we can say a break below the 61.8% Fib retracement level of the recent move from the $18.05 low to $19.99 high at $18.79 might open the doors for $18.05 in the short term.
Hourly MACD – The MACD is almost done with the bullish zone, and about to change the slope.
Hourly RSI – The RSI has moved below the 50 level, which is a bearish sign.
Major Support Level – $19.00
Major Resistance Level – $19.40
Charts courtesy – SimpleFX