Key Highlights
- There was a recovery initiated in ETH price above $125 against the US Dollar, which is a positive sign.
- There is a bearish trend line with resistance at $164 formed on the hourly chart (ETH/USD, data feed via SimpleFX).
- On the downside, there is a key support formed around the $138-140 levels.
Ethereum price recovered well against the US Dollar and Bitcoin, and now ETH/USD is placed well above a major support area at $138-140.
Ethereum Price Trend Line Resistance
It was a roller coaster ride for ETH price against the US Dollar, as it dipped towards $100 and then recovered sharply. After a harsh downside move at $98.35, the price started a recovery. It moved above the 23.6% Fib retracement level of the last decline from the $203.45 high to $98.35 low to initiate a bounce back. The best past was ETH moving above the $138-140 resistance.
The stated $140 zone is a major pivot area, and a close above it is very positive. The price has also moved above the 50% Fib retracement level of the last decline from the $203.45 high to $98.35 low. At the moment, there is a bearish trend line with resistance at $164 formed on the hourly chart of ETH/USD. It is acting as a hurdle around $165. Moreover, the 100 hourly simple moving average is also at $164.
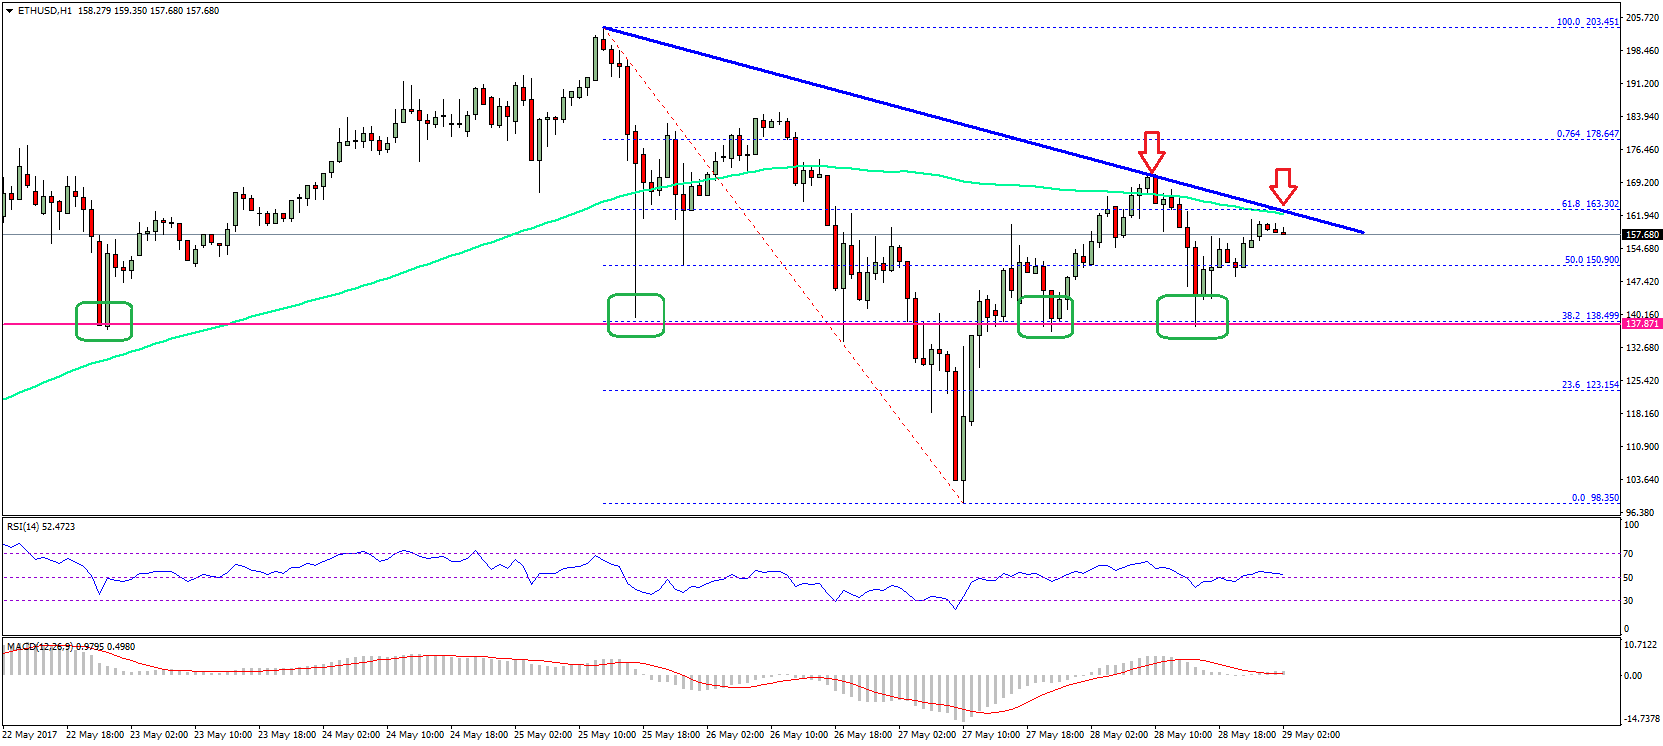
We need a close above the 100 hourly simple moving average or $165 for further gains in the near term. The next hurdle on the upside could be at $178. It coincides with the 76.4% Fib retracement level of the last decline from the $203.45 high to $98.35 low. On the downside, the most important buy area is near $138-140, which holds the key going forward.
Hourly MACD – The MACD is currently flat, and waiting for the next move.
Hourly RSI – The RSI is now above the 50 level.
Major Support Level – $138.00
Major Resistance Level – $165.00
Charts courtesy – SimpleFX