Key Highlights
- ETH price after trading as high as $10.84 against the US Dollar found sellers and started a correction.
- There was a bullish trend line formed on the hourly chart (data feed via SimpleFX) of ETH/USD, which was cleared during the downside move at $10.70.
- The pair is currently correcting lower, and looks poised for an extension.
Ethereum price after trading towards $10.85 against the US Dollar started a correction, and ETH/USD may now look for a move towards $10.40-10.30.
Ethereum Price Downside Move
We saw a nice and solid upside move in ETH price against the US Dollar. It traded past $10.50 for a move towards $10.80. ETH price formed a high at $10.84, as the price faced resistance around the stated level, and started correcting lower. It moved below the 23.6% Fib retracement level of the last wave from the $9.57 low to $10.84 high, which ignited a downside move.
During the downside move, there was a break below a bullish trend line formed on the hourly chart (data feed via SimpleFX) of ETH/USD at $10.70. ETH/USD pair traded down sharply and tested the 38.2% Fib retracement level of the last wave from the $9.57 low to $10.84 high. It found support, as the 100 hourly simple moving average was also positioned around the same level.
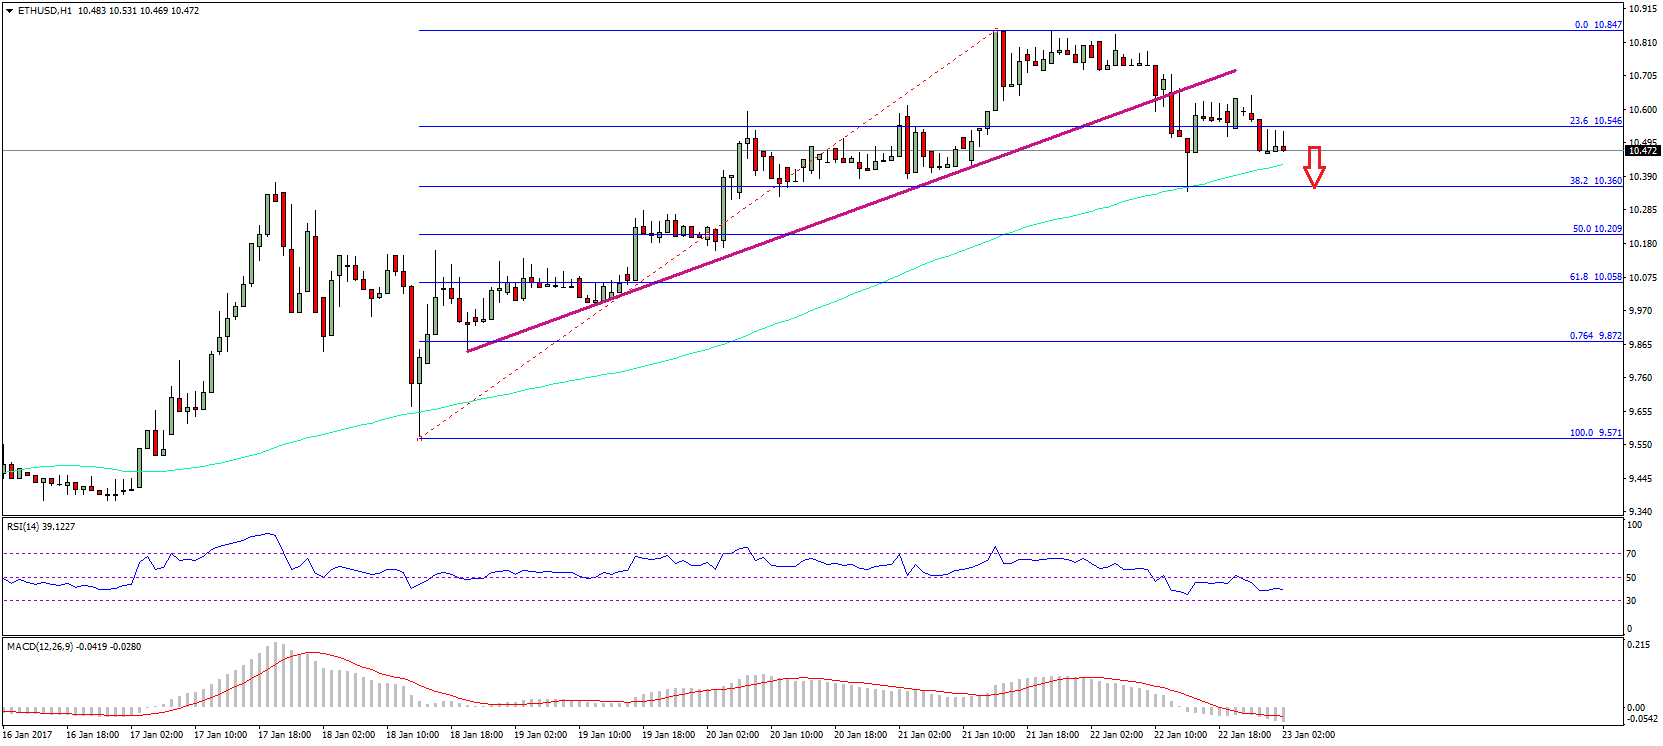
The pair moved a few points higher, but it looks like the correction is not over yet. The pair is again moving down. It looks like it may retest 100 hourly simple moving average or even break $10.40. It would be interesting to see how the price trades in the near term, as there is a pressure sighted on the ETH buyers.
Hourly MACD – The MACD is now in the bearish zone, signaling a downside move.
Hourly RSI – The RSI is also below the 50 level, which is a bearish sign.
Major Support Level – $10.30
Major Resistance Level – $10.70
Charts courtesy – SimpleFX