Key Highlights
- ETH price nosedived yesterday against the US Dollar and Bitcoin, and later bounced back sharply.
- Yesterday’s highlighted two bearish trend lines on the hourly chart (data feed via SimpleFX) of ETH/USD were broken to ignite gains.
- The price recovered sharply, which is a positive sign, and may boost the ETH in the short term.
Ethereum price traded sharply lower yesterday against the USD and BTC, but later found support and recovered a lot to set a positive tone.
Ethereum Price Recovery
ETH price was under a lot of bearish pressure against the US Dollar, which ignited a sharp downside move towards $5.80-$6.00. Before making a downside move, the price failed to break the 38.2% Fib retracement level of the last decline from the $7.53 high to $6.39 low. There was a new low formed at $5.69. Later, the ETH/USD pair found support, and managed to recover. There was a nice upside move, as the pair moved back above the $7.00 handle.
It is a positive sign and means there are chances of further gains in the short term. The most important thing is that the pair moved above yesterday’s highlighted two bearish trend lines on the hourly chart (data feed via SimpleFX). The pair also moved above the 100 hourly simple moving average, which is a positive sign. The price traded as high as $7.69, and currently correcting lower.
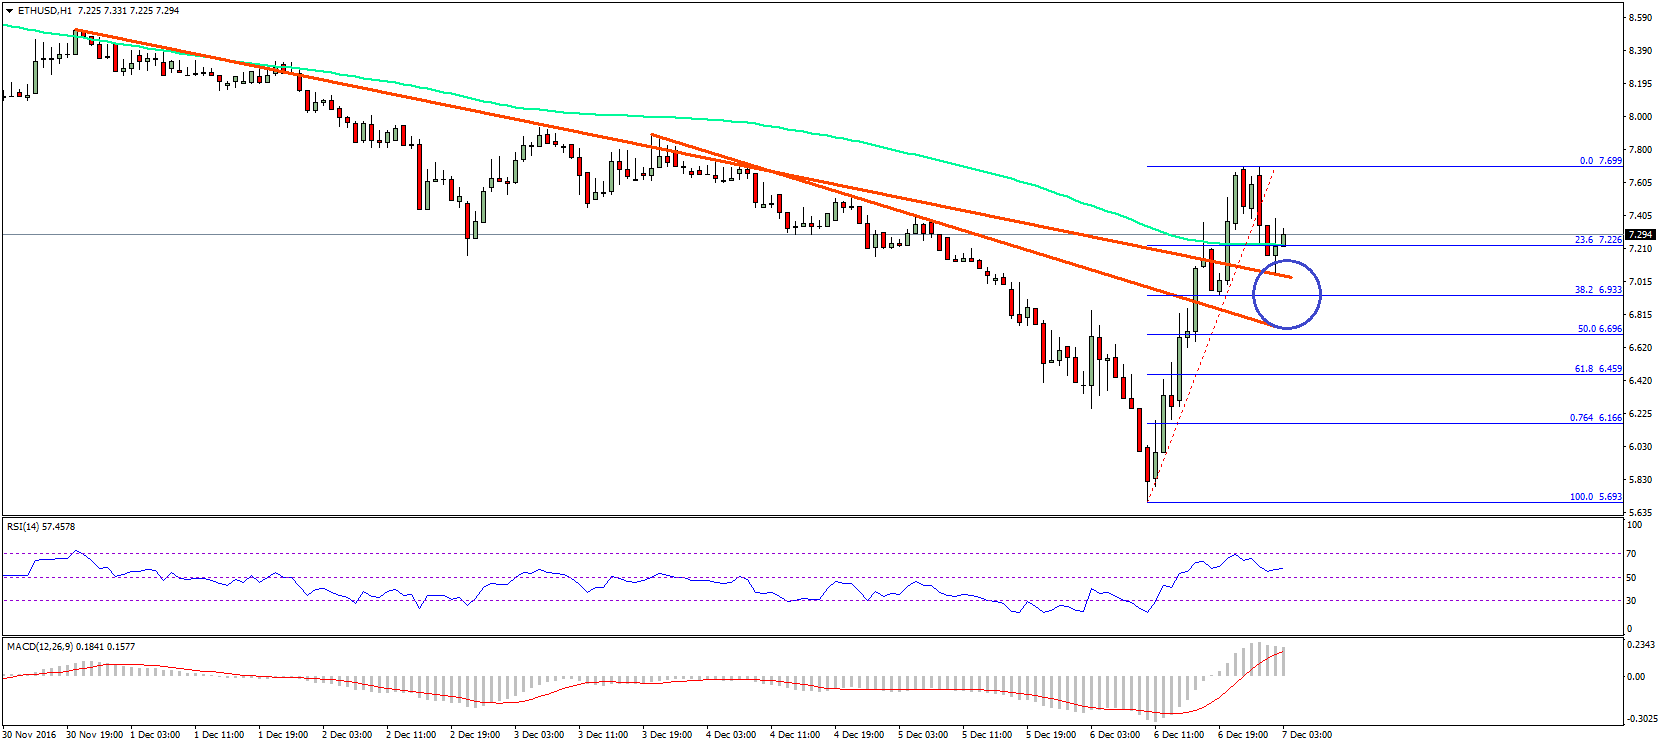
It is currently testing the 23.6% Fib retracement level of the last wave from the $5.69 low to $7.69 high, which is acting as a support. Moreover, the broken trend lines are also acting as a support along with the 100 hourly simple moving average.
Hourly MACD – The MACD has moved from the bearish to bullish zone, which is a bullish sign.
Hourly RSI – The RSI has also moved above the 50 level, calling for more gains.
Major Support Level – $7.00
Major Resistance Level – $7.60
Charts courtesy – SimpleFX