Key Highlights
- ETH price remained lifeless and was seen trading in a range above $12.50 against the US Dollar.
- There is a clear bearish trend line with resistance near $12.75-12.80 formed on the hourly chart of ETH/USD (data feed via SimpleFX).
- On the downside, the pair remains supported near $12.40, which is the range lower end.
Ethereum price was seen trading in a range with resistance at $12.80 against the US Dollar. Let’s see what’s stopping the ETH/USD pair.
Ethereum Price Range
During the past two days, there was almost no action in ETH price against the US Dollar. The price was seen trading in a range with resistance near $12.75 and $12.80. After trading as high as $13.24, the price started a correction, and traded towards $12.40. The price found support, and likely completed a correction. However, there no major move after that, and the price traded in a range.
The price is currently above the 23.6% Fib retracement level of the last decline from the $13.24 high to $12.42 low. It also traded towards $12.75-12.80 levels on a couple of occasions where it failed, and moved down. At the moment, the price is below the 38.2% Fib retracement level of the last decline from the $13.24 high to $12.42 low. There is no sign of a move in the short term. We need to see how long the price can trade in a range before breaking $12.80.
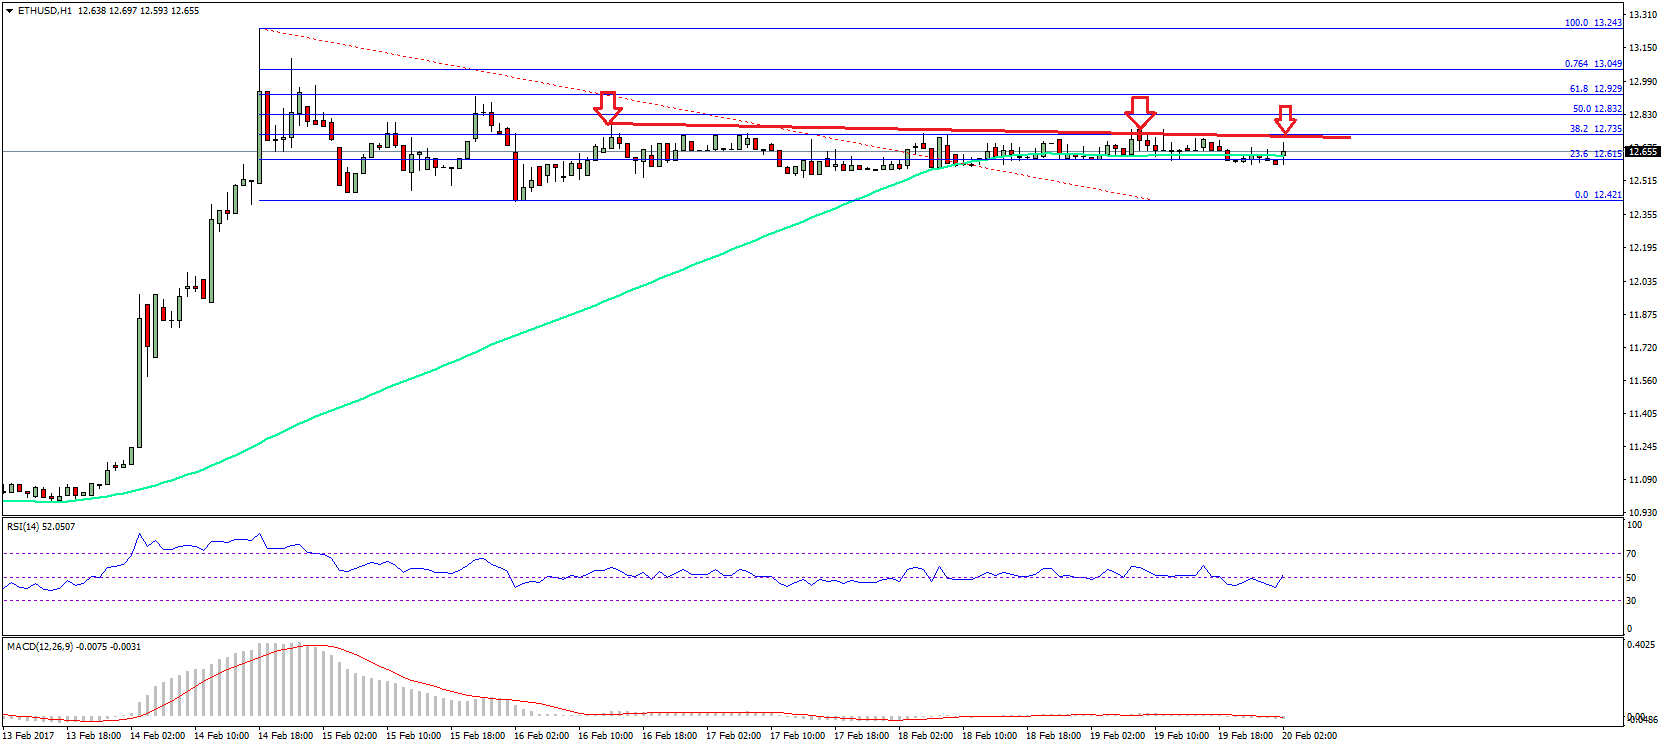
Also, a bearish trend line is formed on the hourly chart of ETH/USD (data feed via SimpleFX) with resistance near $12.75-12.80. So, a clear break above $12.80 might take the price higher in the near term.
Hourly MACD – The MACD is moving with a flat structure with no real direction.
Hourly RSI – The RSI is just moving up and down with no sign of a break in the short term.
Major Support Level – $12.40
Major Resistance Level – $12.80
Charts courtesy – SimpleFX