Key Highlights
- ETH price declined further below $140.00 against the US Dollar and currently correcting higher.
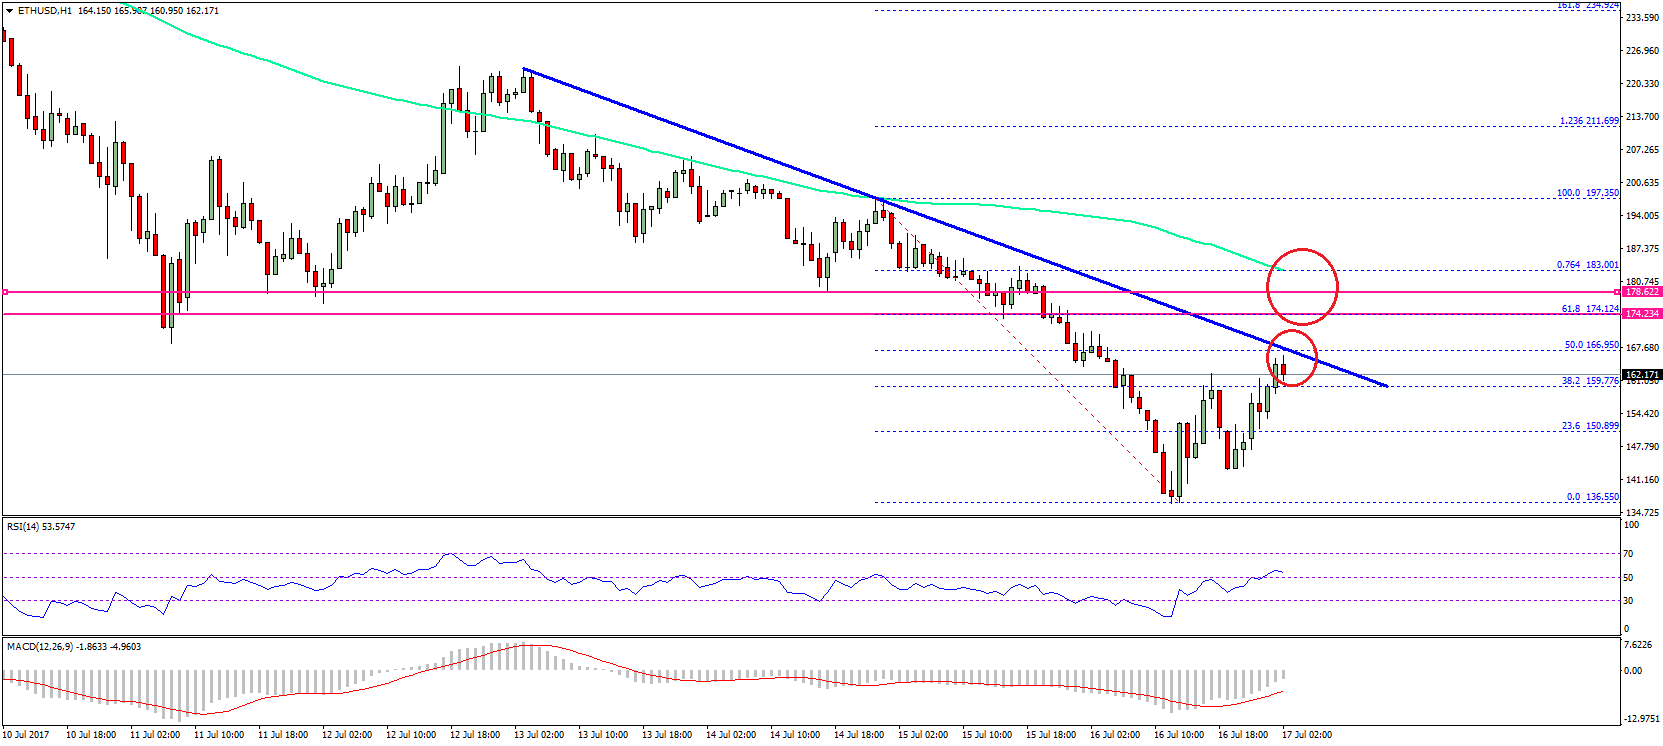
- There is a new connecting bearish trend line with resistance at $166 forming on the hourly chart of ETH/USD (data feed via SimpleFX).
- The price remains capped near $155 and $178, and any major recoveries may find hurdles.
Ethereum price maintained its bearish bias against the US Dollar and Bitcoin, and the current correction in ETH/USD remains capped near $155-178.
Ethereum Price Decline Continues
The past few days were super bearish for ETH price as it declined below $200 and $180 against the US Dollar. The price recently traded as low as $136.55 where it found bids and currently correcting higher. It has already moved above the 23.6% Fib retracement level of the last decline from the $197.35 high to $136.55 low. However, any major recoveries from the current levels may be difficult since there are many hurdles like $155 and $178.
On the upside, there is a new connecting bearish trend line with resistance at $166 forming on the hourly chart of ETH/USD. The same trend line resistance is also near the 50% Fib retracement level of the last decline from the $197.35 high to $136.55 low. Even if there is a break above the trend line at $156, there is another barrier at $178. The stated level is a pivot zone around $180, which also coincides with the 100 hourly simple moving average.
Only a successful close above $180 or the 100 hourly simple moving average may avert the current bearish trend. If the price fails, it may resume the downtrend, and could even retest $140. However, sellers also need to be careful, considering the price has decent supports near $140-130.
Hourly MACD – The MACD is currently reducing the bearish slope.
Hourly RSI – The RSI has just moved above the 50 level.
Major Support Level – $140
Major Resistance Level – $178
Charts courtesy – SimpleFX