Key Highlights
- ETH price is showing a few positive signs against US Dollar, but still a long way to go.
- Yesterday’s highlighted bearish trend line on the hourly chart (data feed via SimpleFX) of ETH/USD was broken, but there was no momentum.
- The price has also moved above the 100 hourly simple moving average, but buyers need to gain control.
Ethereum price looks like attempting to recover in the short term against the US Dollar. Can ETH/USD continue with the recent break?
Ethereum Price Upside Break
We saw how there was decline towards $6.80 in ETH price against the US Dollar. Later, the price traded in a range for some time, and then started correcting higher. During the recent upside move, the price managed to break the 23.6% Fib retracement level of the last decline from the $7.82 high to $6.83 low. It opened the doors for the ETH buyers to take the price further higher.
Yesterday, I highlighted a bearish trend line on the hourly chart (data feed via SimpleFX) of ETH/USD. It was acting as a resistance. However, the pair later managed to clear the trend line resistance at $7.08. Moreover, there was a close above the 100 hourly simple moving average. These two are positive signs, but there is a concern. There was no real momentum after the break. And, the price is still below a major pivot area of $7.20. Unless there is a break above the mentioned pivot level, the price remains at a risk.
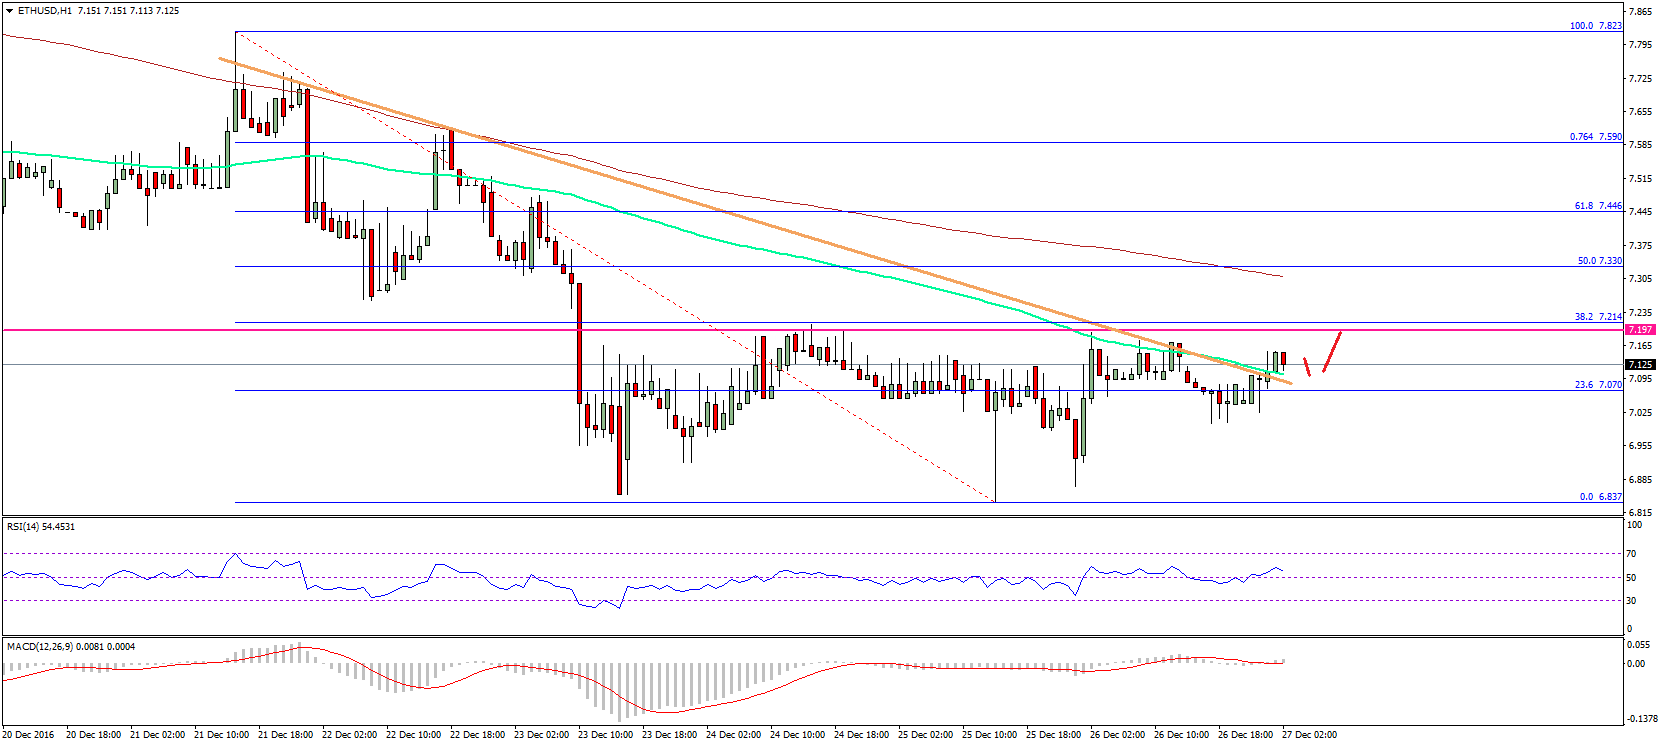
Moreover, the same level is also positioned with the 38.2% Fib retracement level of the last decline from the $7.82 high to $6.83 low. So, we can say the next hurdle on the upside for the ETH buyers is at $7.20.
Hourly MACD – The MACD is about to move into the bullish zone, which may ignite more gains.
Hourly RSI – The RSI also moved above the 50 level, which is a positive sign.
Major Support Level – $7.00
Major Resistance Level – $7.20
Charts courtesy – SimpleFX