
Key Highlights
- ETH price corrected lower further against the US Dollar, but found support near $9.60.
- There is a connecting bearish trend line formed on the hourly chart (data feed via SimpleFX) of ETH/USD, which is currently acting as a resistance near $10.05.
- The price remains supported on the downside, as an earlier resistance is now acting as a barrier for sellers near $9.60.
Ethereum price dived yesterday towards $9.60 against the US Dollar, but found support, and it looks like ETH/USD may attempt to trade higher.
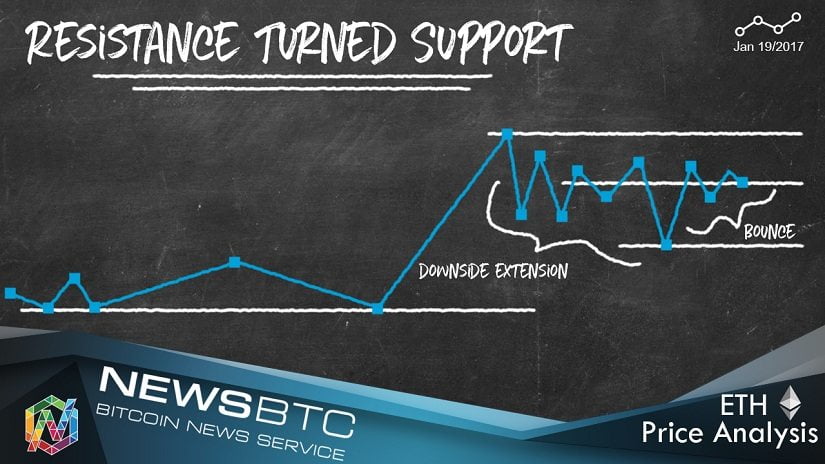
Ethereum Price Resistance
There was a downside extension yesterday in ETH price against the US Dollar, taking it towards the $9.60 area. The stated level acted as a support and prevented the downside move. It is important to note that earlier, the same level was a resistance. And, now it acted as a support near $9.60, which is a positive sign. Moreover, the price bounced from the 76.4% Fib retracement level of the last wave from the $9.37 low to $10.37 high.
Another important point was the fact that the price bounced from the 100 hourly simple moving average. The price is now back higher, but facing sellers near a connecting bearish trend line formed on the hourly chart (data feed via SimpleFX) of ETH/USD. So, there is a resistance near $10.05, which also coincides with the 61.8% Fib retracement level of the last decline from the $10.37 high to $9.57 low.
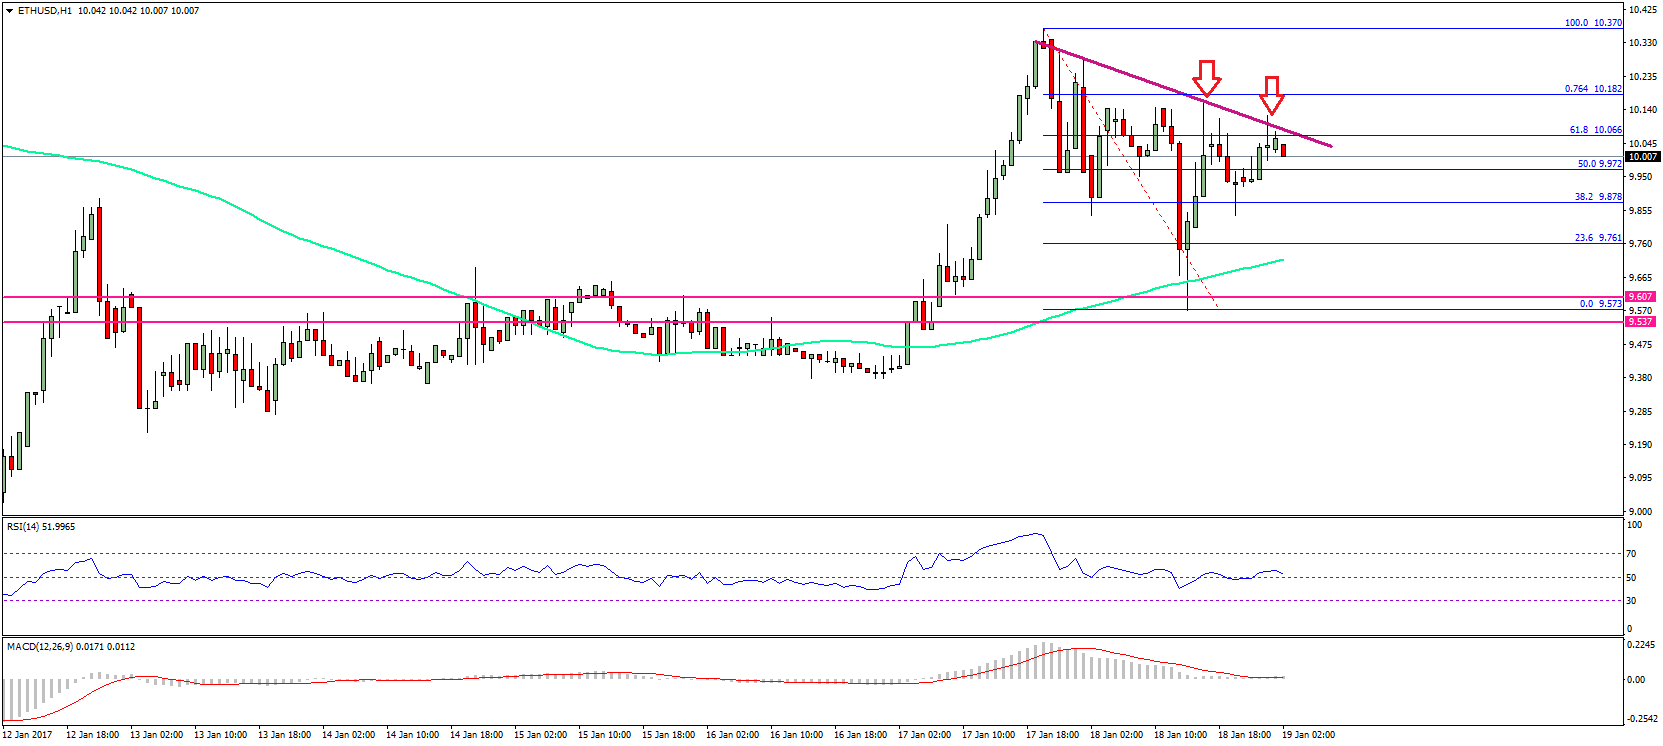
So, it looks like the price is back in the bullish zone, and may looks to trade higher. However, it needs to break the trend line resistance near $10.05 for further gains. If all goes well, there can be a test of $10.20 in the near term.
Hourly MACD – The MACD is currently flat, suggesting range moves.
Hourly RSI – The RSI is now back above the 50 level.
Major Support Level – $9.60
Major Resistance Level – $10.05
Charts courtesy – SimpleFX