Key Highlights
- ETH price started a correction after trading as high as $255.74 against the US Dollar.
- Yesterday’s highlighted major bullish trend line with support at $205 on the hourly chart of ETH/USD (data feed via SimpleFX) was broken.
- The price is bouncing back, and it looks like a correction towards $185 is now complete.
Ethereum price likely completed a short-term correction against the US Dollar and Bitcoin. Now, ETH/USD is about to resume its bullish trend.
Ethereum Price Upside Move
Yesterday, we saw a rally in ETH price above the $250 level against the US Dollar. The price traded as high as $255.74 before starting a correction. During the correction wave, the price was able to break the 50% Fib retracement level of the last wave from the $136.50 low to $255.74 high. Also during the downside move, there was a break below yesterday’s highlighted major bullish trend line with support at $205 on the hourly chart of ETH/USD.
The pair traded towards the 100 hourly simple moving average at $185 where it found support. The stated level was also above the 61.8% Fib retracement level of the last wave from the $136.50 low to $255.74 high. The price is now recovering well, and it looks like a correction towards $185 is now complete. A move above the 23.6% Fib retracement level of the last decline from the $255.74 high to $185.43 low is a positive sign.
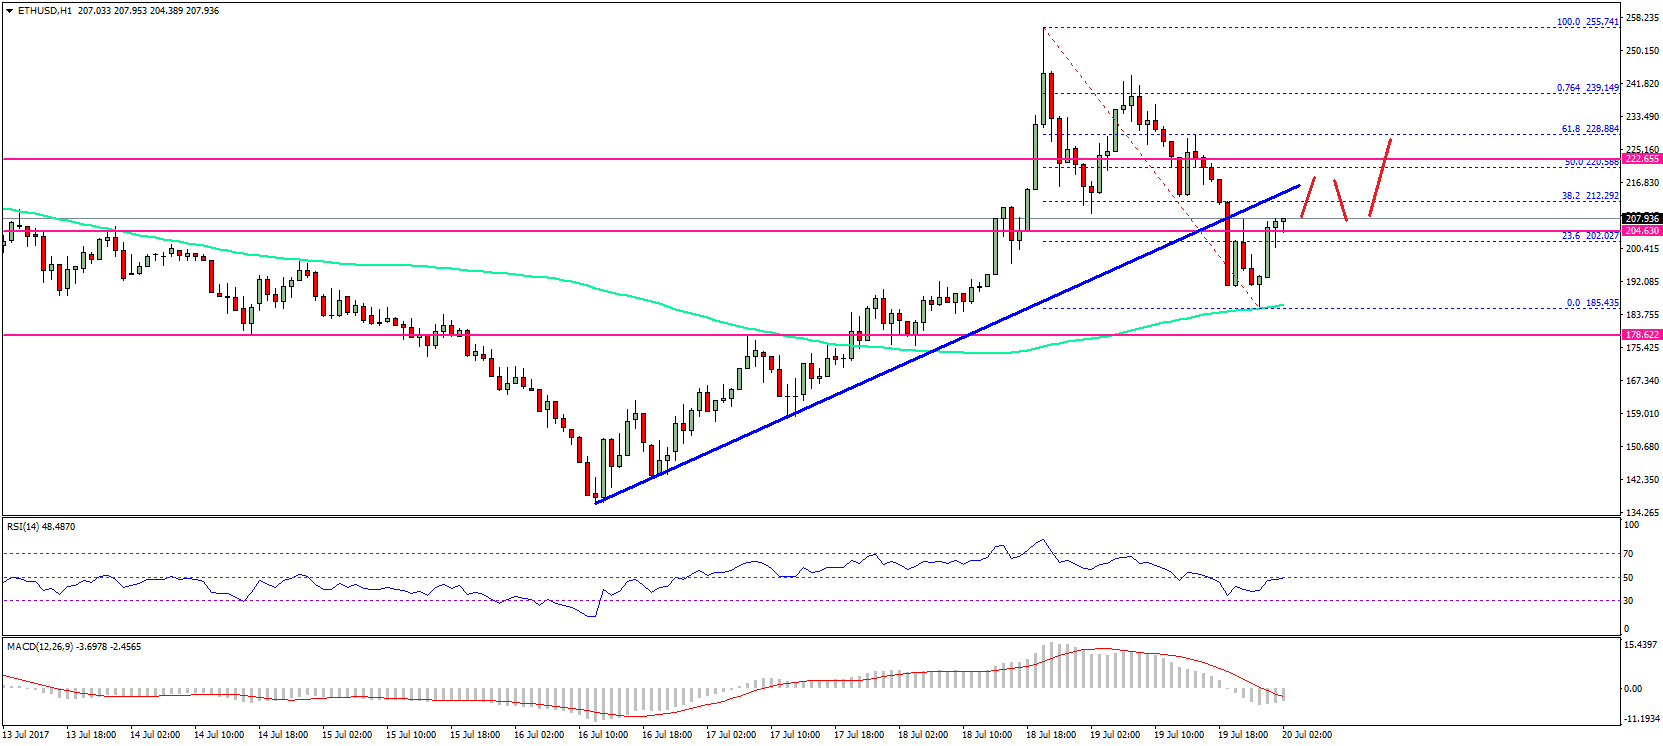
The price now needs to settle above the $200 level. Once it does, it can easily break $215 and the 38.2% Fib retracement level of the last decline from the $255.74 high to $185.43 low. Buying dips close to the 100 SMA or $190 may be considered in the short term.
Hourly MACD – The MACD is about to move back in the bullish zone.
Hourly RSI – The RSI is higher towards the 50 level.
Major Support Level – $190
Major Resistance Level – $215
Charts courtesy – SimpleFX