Key Highlights
- After a minor decline towards $135, ETH price formed support against the US Dollar and moved higher.
- There was a break above a bearish trend line at $159 on the hourly chart (ETH/USD, data feed via SimpleFX).
- The price is currently following an ascending channel pattern and looks set for a move above $170.
Ethereum price formed a base after yesterday’s dip against the US Dollar and Bitcoin, and now ETH/USD is following a nice uptrend.
Ethereum Price Heading Higher
Recently, there was a dip towards $135-140 in ETH price against the US Dollar. Later, it formed a good base at $140 and started an upside move. First, there was a break above the 23.6% Fib retracement level of the last decline from the $171.76 high to $136.70 low. It initiated a decent recovery, and the price managed to move above the $150 resistance.
The best part was a break above yesterday’s highlighted bearish trend line at $159 on the hourly chart of ETH/USD. Moreover, the price climbed above the 50% Fib retracement level of the last decline from the $171.76 high to $136.70 low. At the moment, the price is following an ascending channel pattern with support at $162 on the hourly chart. As long as the price is inside the pattern, it may climb towards $170 or might even break it.
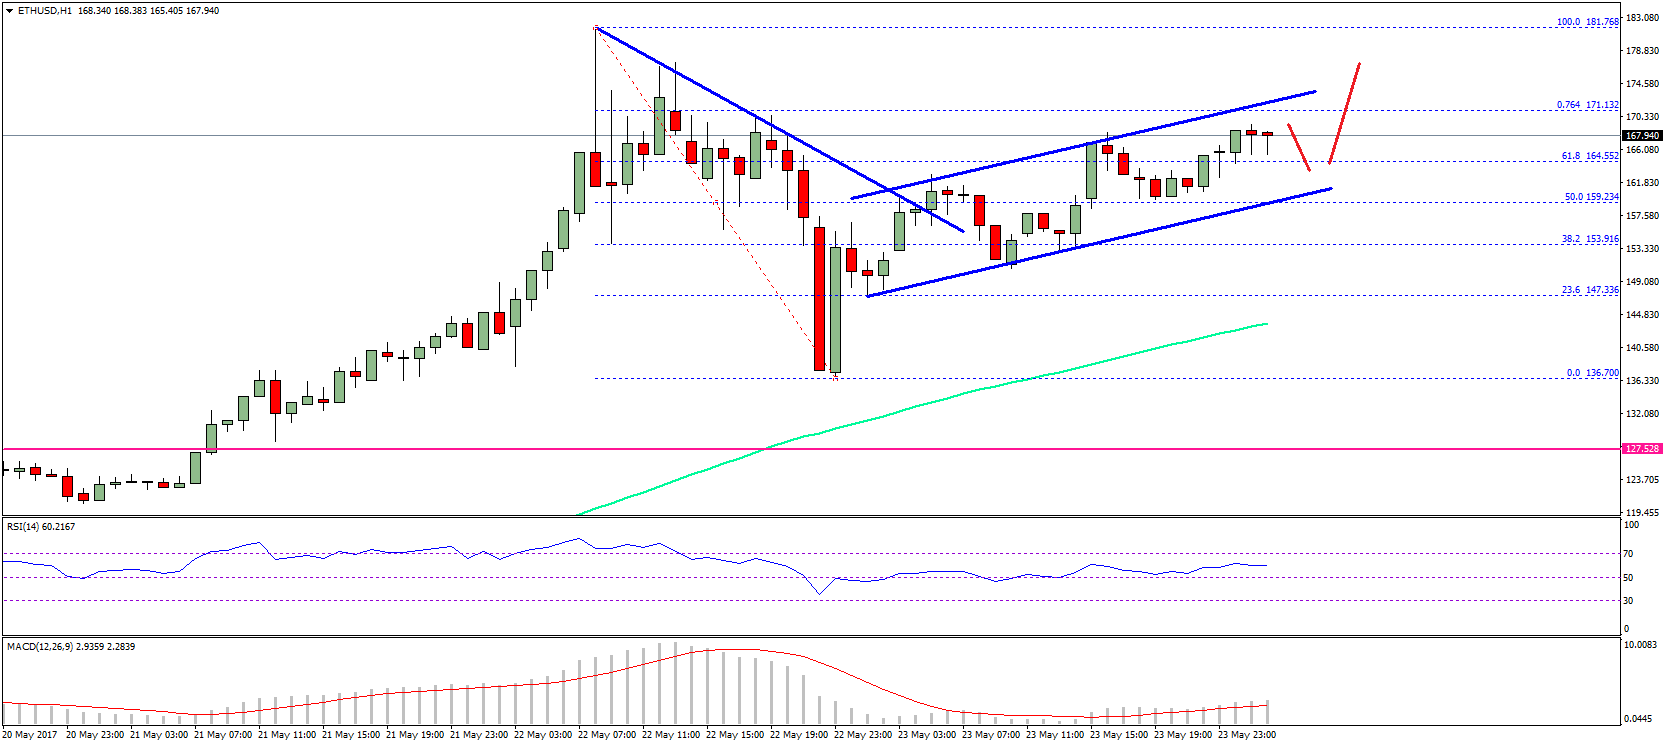
The next hurdle on the upside is around the 76.4% Fib retracement level of the last decline from the $171.76 high to $136.70 low at $171.13. If buyers manage to break it, a retest of $181.00 is very likely in the near term. On the downside, we can keep a watch on the $162 and $155 support levels.
Hourly MACD – The MACD is back in the bullish zone.
Hourly RSI – The RSI is now placed well above the 50 level, and heading higher.
Major Support Level – $162.00
Major Resistance Level – $171.00
Charts courtesy – SimpleFX