Key Highlights
- ETH price after a downside move found support at $240 against the US Dollar and traded higher.
- There was a bearish trend line with resistance at $265 on the hourly chart of ETH/USD (data feed via SimpleFX), which was broken recently.
- The pair is now moving higher and struggling to close above $280 and the 100 hourly simple moving average.
Ethereum price made a decent upside move against the US Dollar and Bitcoin, and now ETH/USD might break $275 for further gains.
Ethereum Price Trend Line Support
Recently, we saw a few swing moves in ETH price towards $240 against the US Dollar. Later, the price found support and started moving higher above $250. The upside move was decent as there was a break above the 23.6% Fib retracement level of the last decline from the $316 high to $239 low. Moreover, the price was able to gain momentum above the $260 resistance.
During the upside move, the ETH/USD pair also broke a bearish trend line with resistance at $265 on the hourly chart. However, gains were prevented by $280 and the 100 hourly simple moving average. Furthermore, there was also no close above the 50% Fib retracement level of the last decline from the $316 high to $239 low. The price is currently correcting lower, but remains supported above $240.
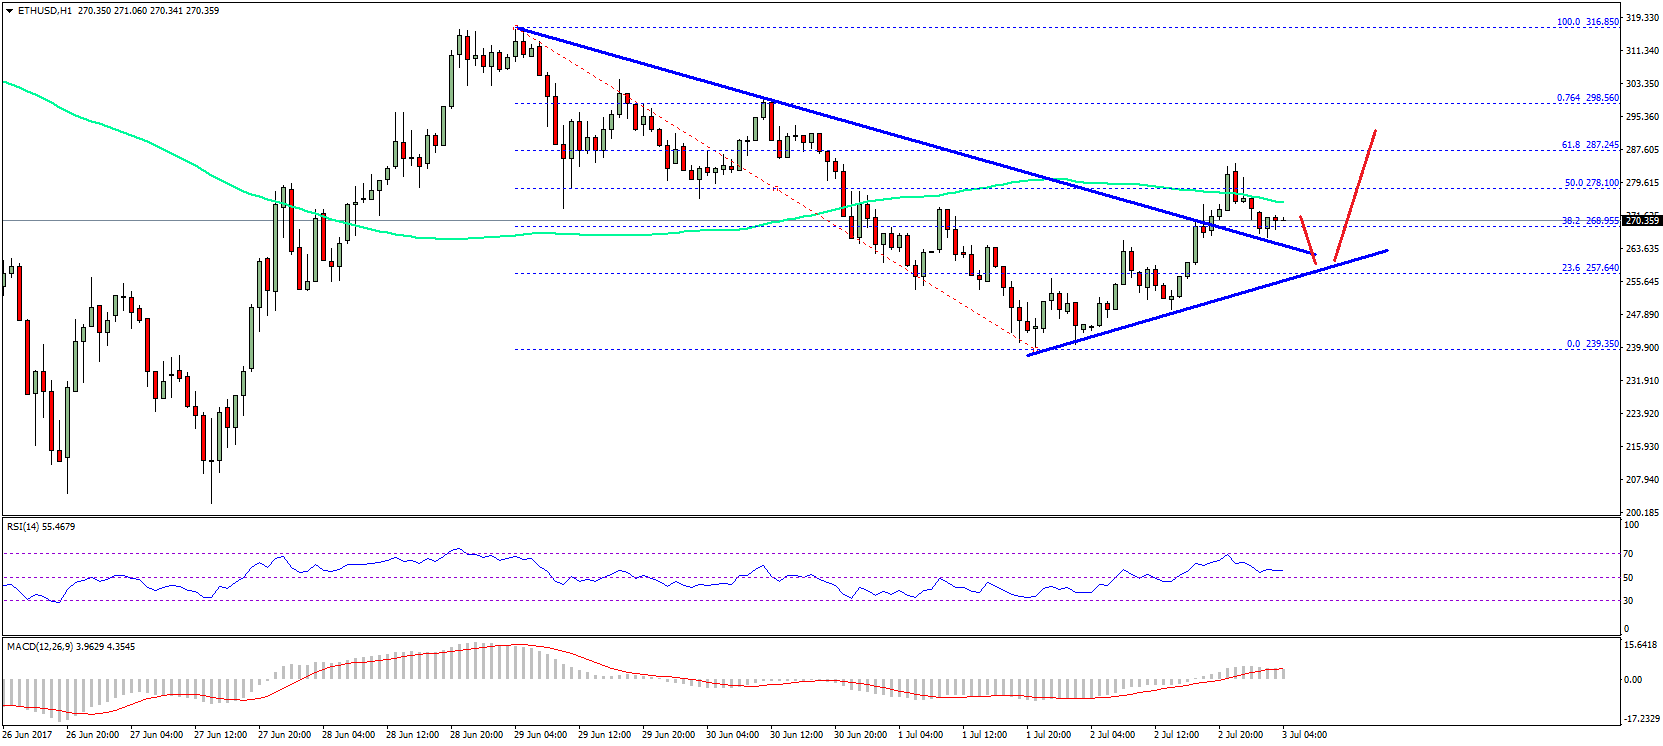
There is also a bullish trend line formed on the same chart with support at $265. There is a chance that the pair may correct a few points lower towards $250-260. However, it is likely to gain pace above $280 and the 100 hourly simple moving average for further gains. The next resistance is near the 76.4% Fib retracement level of the last decline from the $316 high to $239 low at $298.
Hourly MACD – The MACD is back in the bullish zone.
Hourly RSI – The RSI is now above the 50 level.
Major Support Level – $265
Major Resistance Level – $280
Charts courtesy – SimpleFX