Key Highlights
- ETH price managed to remain above the $9.40 support area against the US Dollar, and may trade higher.
- There is an ascending channel pattern formed on the hourly chart (data feed via SimpleFX) of ETH/USD, which taking the price higher.
- The price is currently above the 100 hourly simple moving average, which is a positive sign.
Ethereum price looks like trading above a channel support against the US Dollar, and ETH/USD may continue to slowly rise higher.
Ethereum Price Support Zone
There was a rise towards $9.90 in ETH price against the US Dollar recently where it found sellers, and started a downside move. There was a dip below the 50% Fib retracement level of the last wave from the $9.00 low to $9.88 high. It ignited a downside wave towards the $9.20 support. Somehow, the stated level acted as a support and protected more losses in the short term.
The price also found support near the 76.4% Fib retracement level of the last wave from the $9.00 low to $9.88 high. So, there is a chance that the ETH/USD pair may have completed a correction wave. It is now trading above the $9.40 support area, and following an ascending channel pattern formed on the hourly chart (data feed via SimpleFX). As long as the pair is following the highlighted channel, there are possibilities of more gains in the near term towards $9.70.
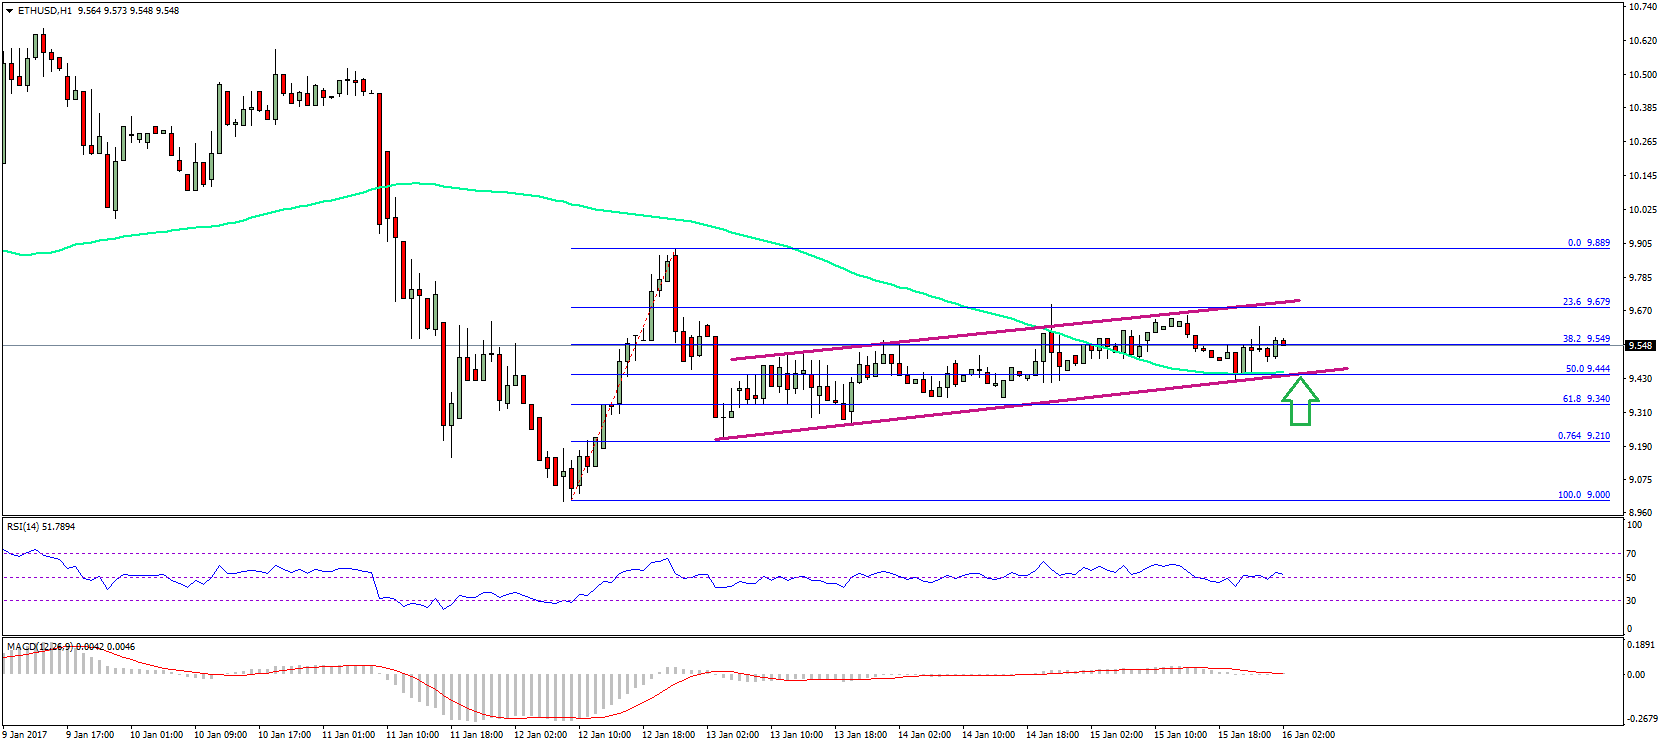
Another important point is the fact that the channel support coincides with the 100 hourly simple moving average. So, the $9.40 level represents a good support. A break below it could only ignite losses in ETH, and take the price towards the last swing low of $9.20.
Hourly MACD – The MACD is almost flat with no sign of a major move.
Hourly RSI – The RSI is just above the 50 level, but with no momentum.
Major Support Level – $9.40
Major Resistance Level – $9.80
Charts courtesy – SimpleFX