Key Highlights
- ETH price fell sharply against the US Dollar and moved below $16.50, as mentioned in yesterday’s post.
- Yesterday’s highlighted bearish trend line with resistance at $17.50 on the hourly chart of ETH/USD (data feed via SimpleFX) is still in play.
- The price is currently recovering, but likely to face sellers once again near $17.50.
Ethereum price moved down against the US Dollar to settle below $17.00. It looks like ETH/USD might remain under a bearish pressure for some time.
Ethereum Price under Pressure
Yesterday, we saw an increase in the bearish pressure on ETH price vs the US Dollar, as it moved below $18.60. The price extended the downside and declined further. There was a sharp downside move, taking the price below the $18.04 support area. It later moved below a couple of support levels like $17.60, $17.50 and $17.00. Overall, the bearish pressure got hold, and the price fell towards $16.00 to form a low at $16.06.
The most important point was yesterday’s highlighted bearish trend line with resistance at $18.70 on the hourly chart of ETH/USD (data feed via SimpleFX). It acted as a perfect resistance and pushed the price down to complete a sell near $16.50. At the moment, the price is recovering from the $16.06 low. It is attempting to break the 23.6% Fib retracement level of the last drop from the $19.10 high to $16.06 low.
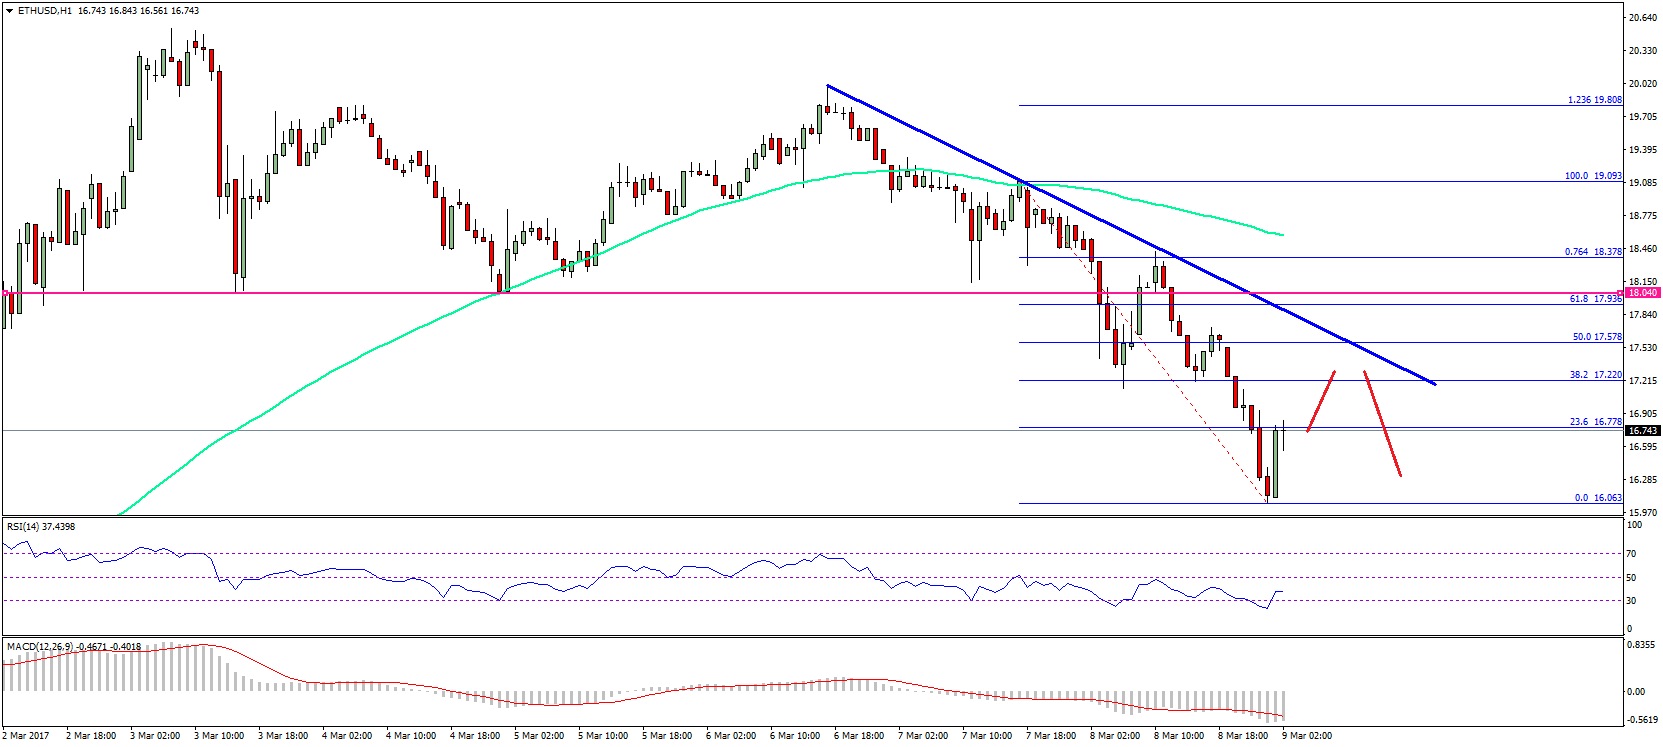
However, the most important resistance is near $17.50. It coincides with the same resistance trend line at $17.55. Also, the 38.2% Fib retracement level of the last drop from the $19.10 high to $16.06 low is at $17.22. So, there are many resistances on the way up for the price.
Hourly MACD – The MACD is now placed well in the bearish zone.
Hourly RSI – The RSI is recovering from the 20 level, but remains well below the 50 level.
Major Support Level – $16.25
Major Resistance Level – $17.50
Charts courtesy – SimpleFX