Key Highlights
- ETH price struggled to close above the $220 resistance against the US Dollar and moved down.
- There is a new contracting triangle pattern forming with support at $194.00 on the hourly chart of ETH/USD (data feed via SimpleFX).
- The price is currently below the $200 level and the 100 hourly simple moving average.
Ethereum price is struggling again against the US Dollar and Bitcoin, and ETH/USD is just holding a major support area near $194-192.
Ethereum Price Resistance
Yesterday, there was a decent recovery in ETH price above $210 against the US Dollar. The price traded higher and tested the $223-225 resistance zone where sellers appeared. As a result, the price failed to gain pace above $223, and a short-term high was formed at $223.73. The price started correcting lower, and moved below $210 and the 100 hourly simple moving average. It traded lower and even managed to move below the $200 support zone.
At the moment, the price is trading just around the $195 level. There is a new contracting triangle pattern forming with support at $194.00 on the hourly chart of ETH/USD. The triangle support is at $194-193. It must hold the downside move or the price could trade back towards $180. On the upside, an initial resistance is near $206 and the 100 hourly simple moving average. The $206 level also coincides with the 50% Fib retracement level of the last decline from the $223 high to $188 low.
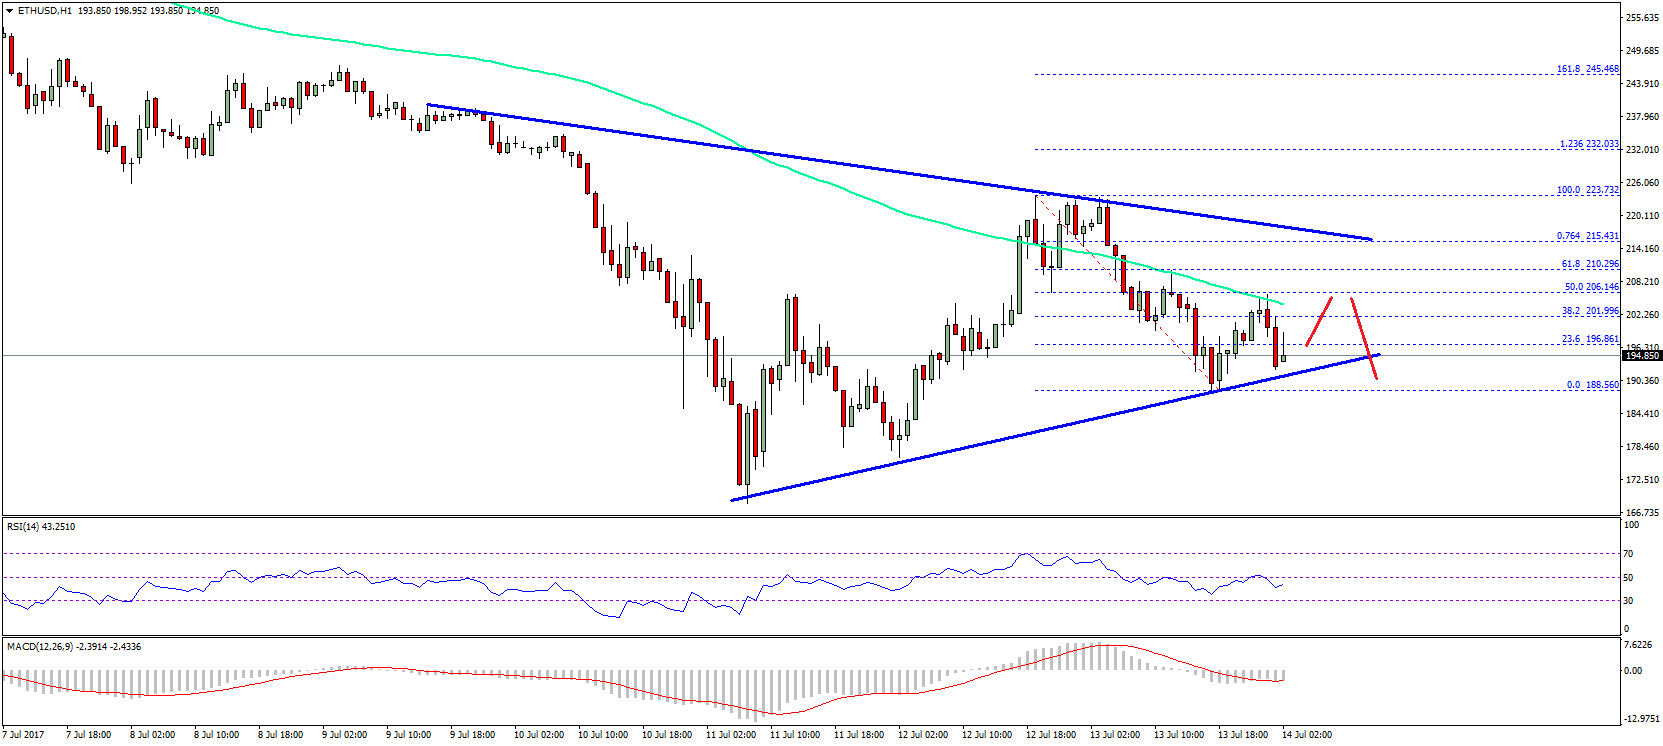
If there is a close above $210 and the 100 hourly simple moving average, the price may test the triangle resistance at $215. It looks like we may see a breakout of the triangle either above $215 or below $190 in the coming sessions.
Hourly MACD – The MACD is now back in the bearish zone.
Hourly RSI – The RSI is currently below the 45 level.
Major Support Level – $190
Major Resistance Level – $215
Charts courtesy – SimpleFX