Key Highlights
- ETH price started a new downside wave from the $305.22 swing high against the US Dollar.
- There is a bearish trend line forming with resistance at $293.80 on the hourly chart of ETH/USD (data feed via SimpleFX).
- The price might continue to move down towards the $291 and $288 support levels.
Ethereum price is in a short-term declining phase against the US Dollar and Bitcoin. ETH/USD might retest $288 to gather bids in the near term.
Ethereum Price Downside Move
There was an upside move recently in ETH price above the $300 level against the US Dollar. The price traded as high as $305.22 where sellers appeared and protected by upsides. A new short-term downside wave was initiated and the price moved below the 23.6% Fib retracement level of the last wave from the $274.65 low to $305.22 high. At the moment, the price is approaching the $291 support and the 100 hourly simple moving average.
The 38.2% Fib retracement level of the last wave from the $274.65 low to $305.22 high is also near $293 to provide support. However, the most important support is near the previous resistance at $288. The mentioned level is just below the 50% Fib retracement level of the last wave from the $274.65 low to $305.22 high. Therefore, the $290-288 support area might hold the current decline.
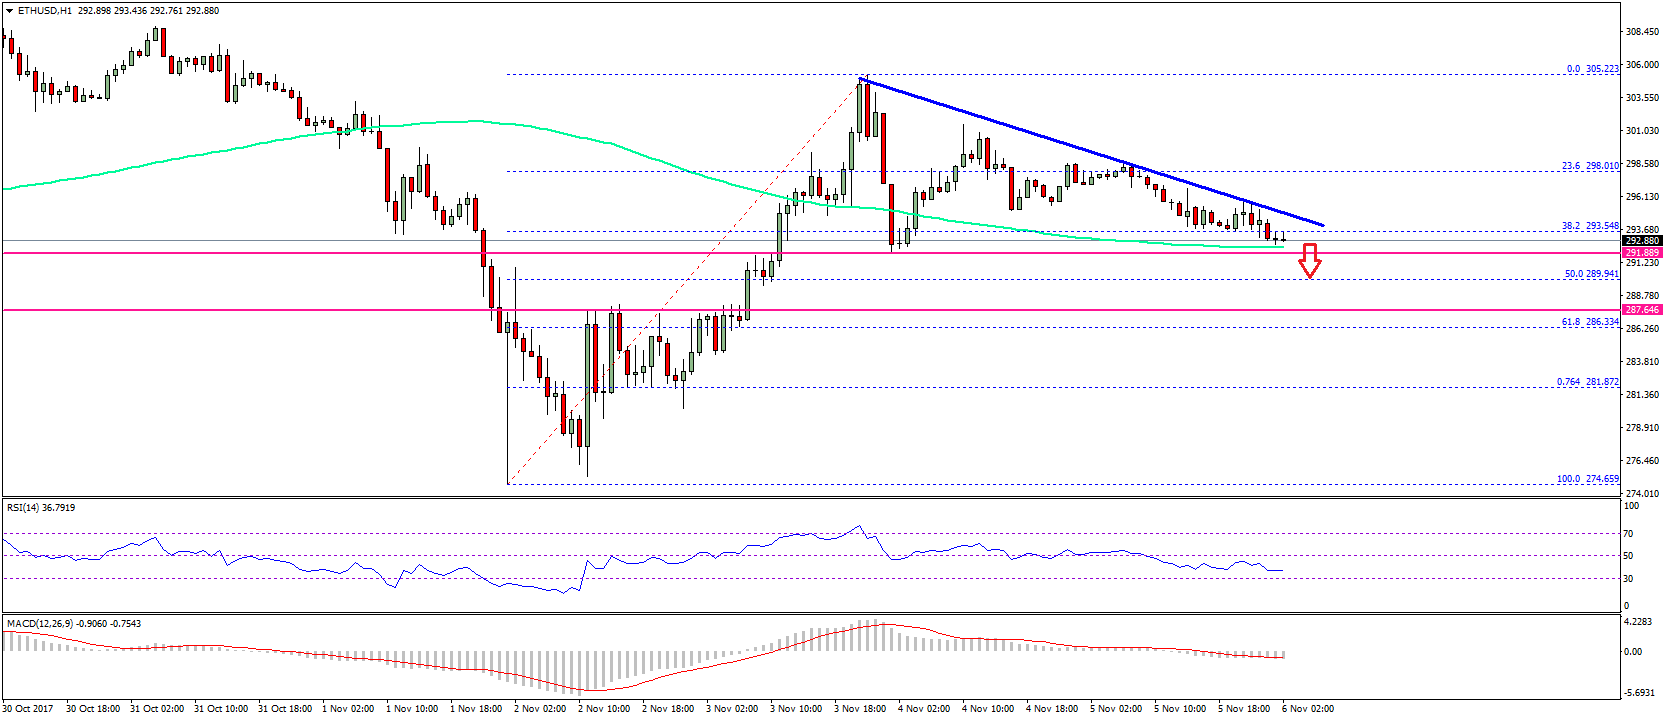
On the upside, there is a bearish trend line forming with resistance at $293.80 on the hourly chart of ETH/USD. Once there is a break above the trend line resistance at $293.80, there are chances of more upsides in the near term. The next major resistance on the upside is at $305.00 followed by the $308-310 area.
Hourly MACD – The MACD is slowly gaining pace in the bearish zone.
Hourly RSI – The RSI is currently well below the 50 level with slight bearish signs.
Major Support Level – $288
Major Resistance Level – $294
Charts courtesy – SimpleFX