Key Highlights
- ETH price after correcting lower against the US Dollar towards $10.30 found support, and traded higher.
- There is a connecting resistance trend line formed on the hourly chart of ETH/USD (data feed via SimpleFX), which is currently acting as a resistance near $10.56.
- The price may break it soon for further gains in the short term towards $10.65.
Ethereum price moved back above the $10.40 level against the US Dollar, and it looks like ETH/USD may trade further higher towards $10.65-10.70.
Ethereum Price Rising Momentum
There was a correction wave initiated yesterday in ETH price against the US Dollar, taking it towards $10.30. The price found support managed to gain bids. The price traded towards the 61.8% Fib retracement level of the last wave from the $10.20 low to $10.52 high. It found support at $10.30-10.35 and started moving back higher. During the upside, the price broke the $10.40 resistance to start a trend.
The price is currently trading near a connecting resistance trend line on the hourly chart of ETH/USD (data feed via SimpleFX). It has a resistance near $10.56, which is currently protecting more upsides. The price is likely to break it soon, and attempt a move towards $10.60-10.65. It may also test the 1.618 extension of the last decline from the $10.53 high to $10.29 low.
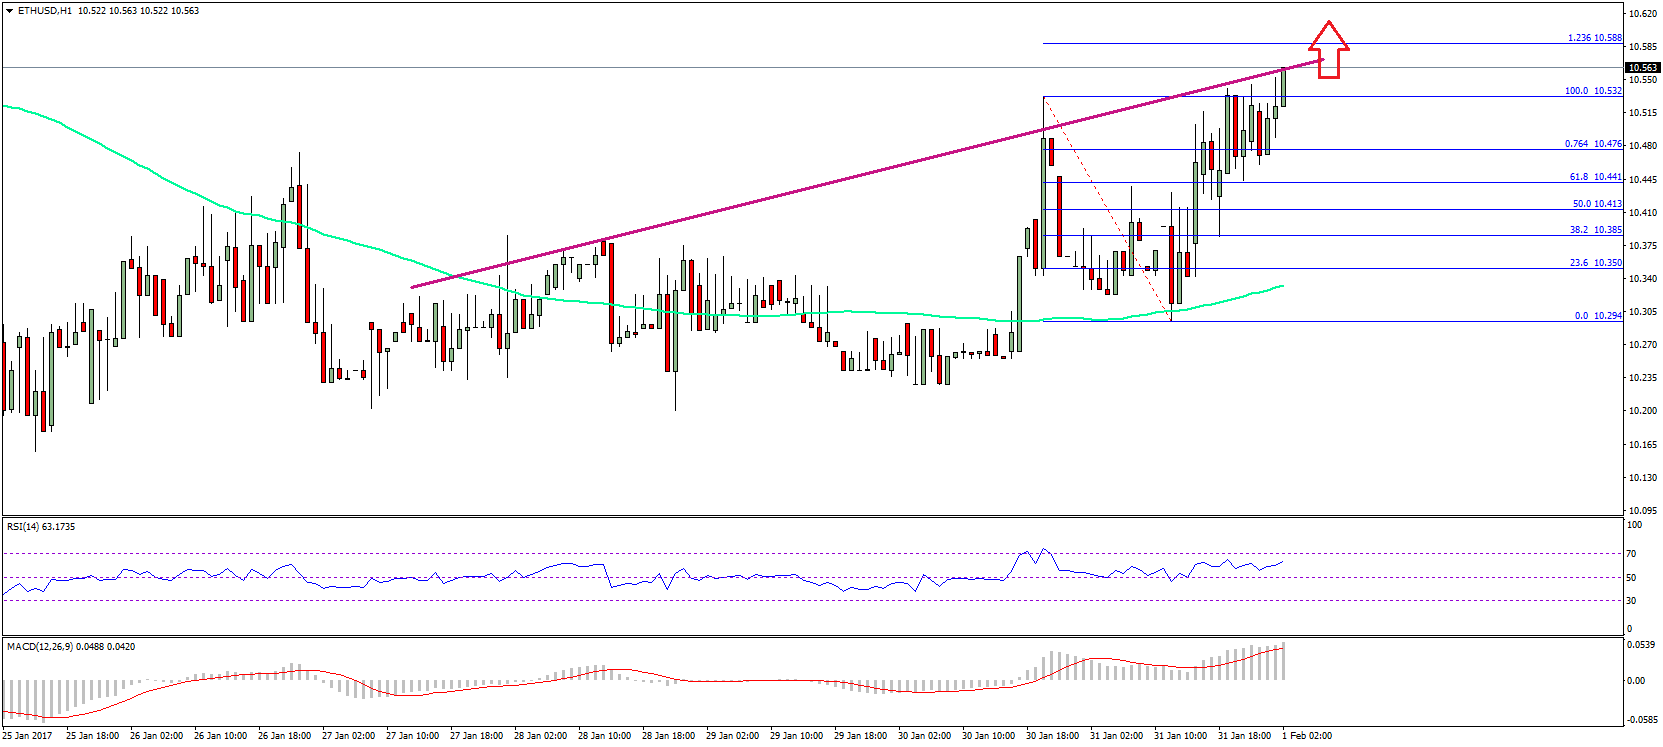
If the current momentum stays intact, there is a high chance of it ETH gaining further momentum towards $10.65. On the downside, the $10.45 level can be seen as an initial support. The next support is at $10.40, and the most important one is at $10.30. Buying dips near $10.40 can be considered as long as the momentum is intact.
Hourly MACD – The MACD is strongly placed in the bullish slope, and gaining momentum.
Hourly RSI – The RSI is heading south and well above the 50 level.
Major Support Level – $10.45
Major Resistance Level – $10.65
Charts courtesy – SimpleFX