Key Highlights
- ETH price is now following a declining path and moved below the $294 support against the US Dollar.
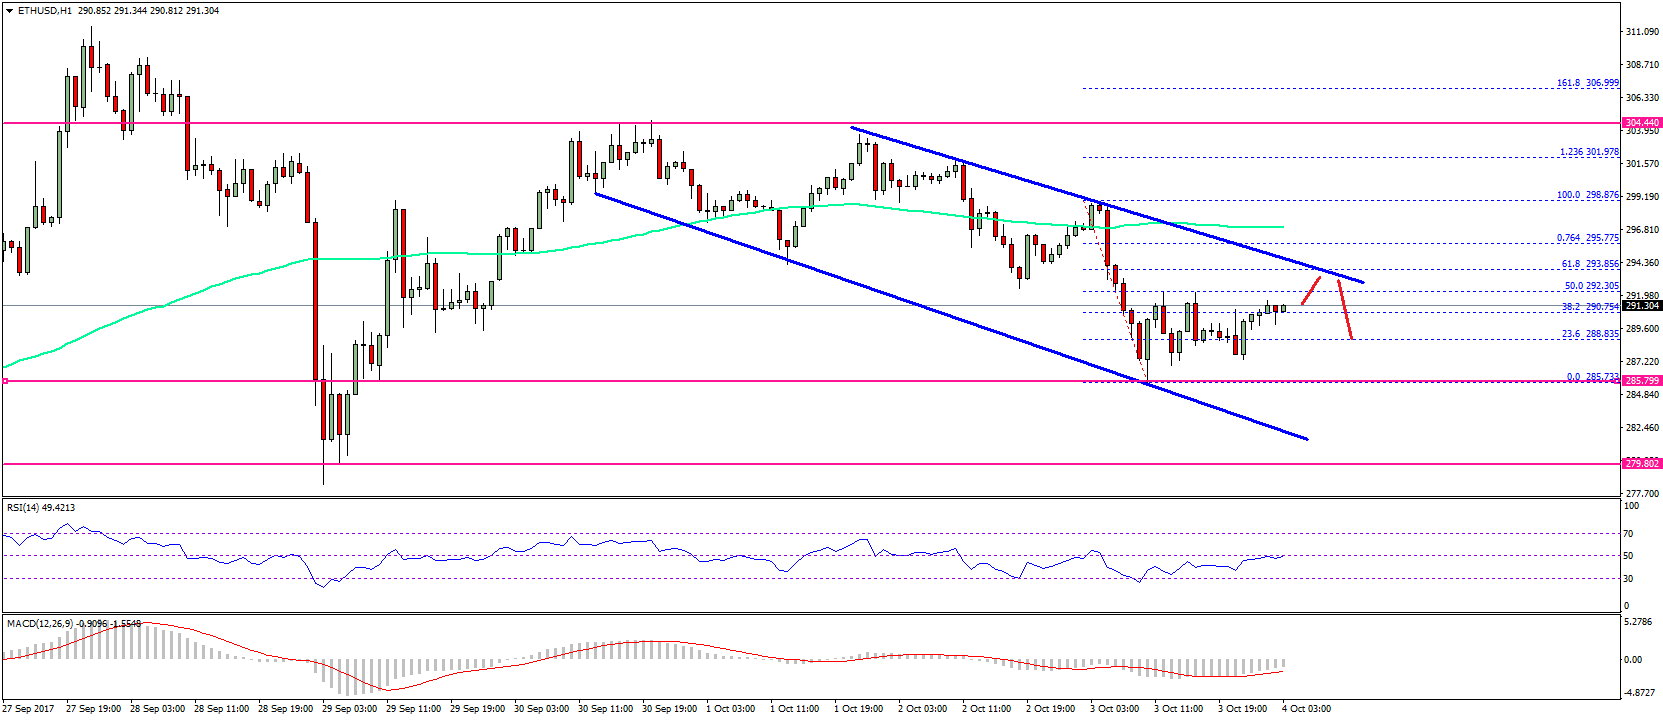
- There is an expanding triangle forming with resistance at $294 on the hourly chart of ETH/USD (data feed via SimpleFX).
- The price might correct higher, but upsides seem to be capped by the $294-296 resistance.
Ethereum price is now under bearish pressure against the US Dollar and Bitcoin. ETH/USD might extend its decline below $290 in the near term.
Ethereum Price Downside Move
There was a minor recovery from the $292 swing low in ETH price yesterday against the US Dollar. The price failed to move above the $299 level and declined. The downside move was strong enough to break the swing low of $292. There was even a break of the $290 support and the price traded as low as $285.73. At the moment, the price is recovering and moved above the 23.6% Fib retracement level of the last decline from the $298.87 high to $285.73 low.
On the upside, there is a major resistance forming near $294. An expanding triangle forming with resistance at $294 on the hourly chart of ETH/USD is waiting to act as a hurdle. An immediate resistance is around the 50% Fib retracement level of the last decline from the $298.87 high to $285.73 low. It won’t be easy for buyers to break the $293-294 resistance area.
However, once there is a close above $294, buyers might step in and push the price above $300. In the short term, there is a lot of bearish pressure below $294. Selling rallies close to $294 can be considered with a tight stop on the short term.
Hourly MACD – The MACD is currently reducing its slope in the bearish zone.
Hourly RSI – The RSI is just below the 50 level and eyeing an upside break.
Major Support Level – $286
Major Resistance Level – $294
Charts courtesy – SimpleFX