Key Highlights
- ETH price remained in an uptrend, and moved above the $52.40 resistance against the US Dollar.
- There are now two bullish trend lines with support at $52.80 and $51.80 formed on the hourly chart (ETH/USD, data feed via SimpleFX).
- The price may continue to move higher, and may even break the $53.60 resistance for further gains.
Ethereum price managed to pop above the $52.40 resistance, and the recent ETH/USD bullish run looks positive for further upsides in the near term.
Ethereum Price Support
There was a tiny downside move in ETH price towards $51.80 against the US Dollar where it found support. Later, the price moved higher, and broke the 76.4% Fib retracement level of the last decline from the $52.45 high to $47.45 low. It opened the doors for more gains above $52.40. The price broke the $52.40 resistance and traded towards the $54.00 handle. The price almost tested the 1.236 extension of the last decline from the $52.45 high to $47.45 low.
At the moment, the price is struggling to clear the $53.60 resistance, and may move down a few points. On the downside, there are two bullish trend lines with support at $52.80 and $51.80 on the hourly chart ETH/USD. The first trend line support coincides with the 23.6% Fib retracement level of the last wave from the $50.60 low to $53.60 high.
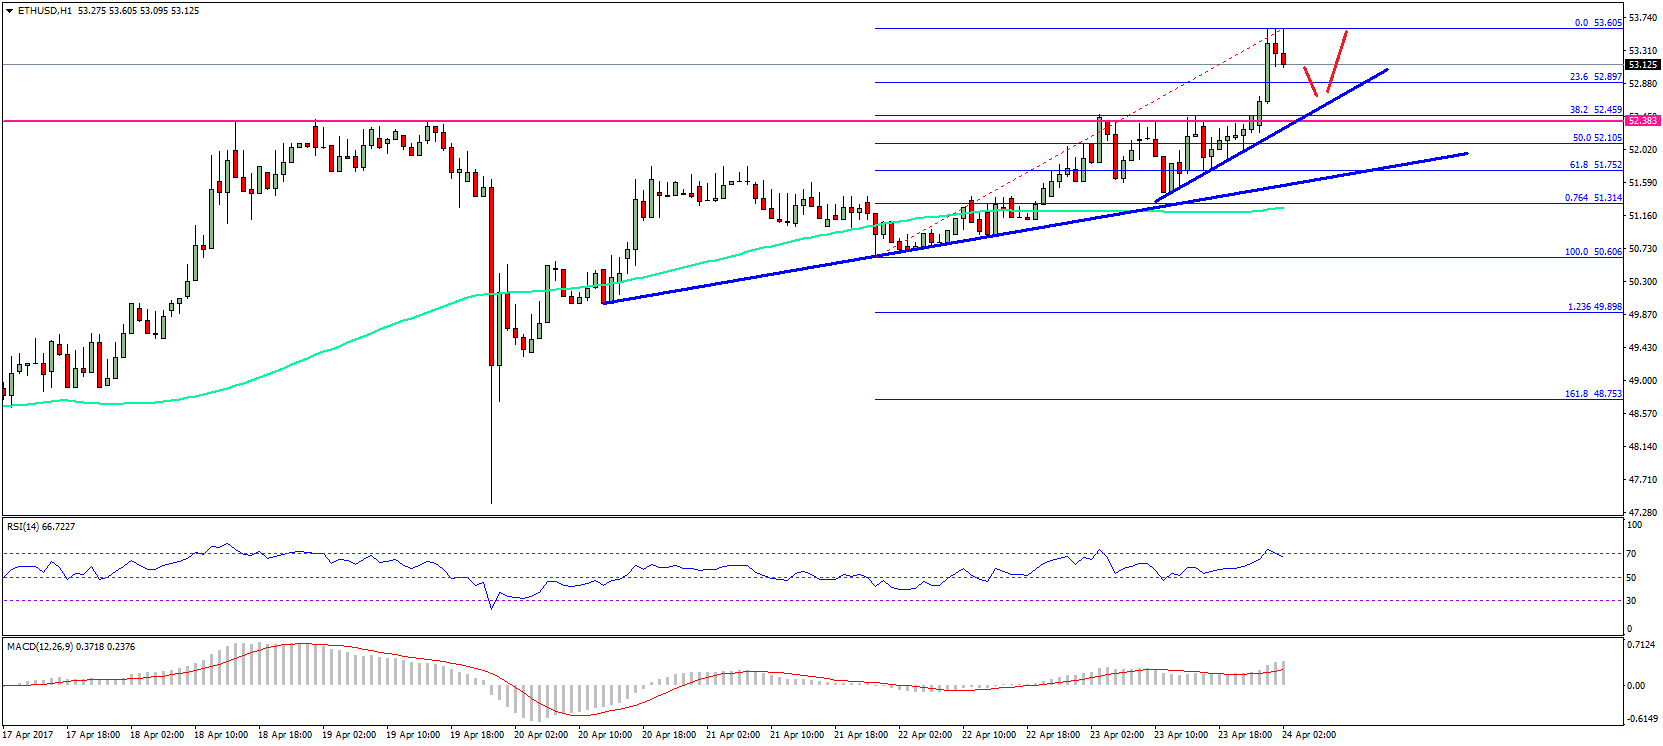
However, the most important support is now at $52.40. The stated level was a resistance earlier, and now may provide support at $52.40-50. It also coincides with the 38.2% Fib retracement level of the last wave from the $50.60 low to $53.60 high. Overall, if the price dips from the current levels, it may find support at $52.80 or $52.40.
Hourly MACD – The MACD is placed well in the bullish zone.
Hourly RSI – The RSI is around the 71 level, and looks stable.
Major Support Level – $52.80
Major Resistance Level – $53.60
Charts courtesy – SimpleFX