Key Highlights
- There was a continuous bid pattern near $86 in ETH price against the US Dollar, which is a good sign.
- The range pattern highlighted in the last analysis with support at $84.50 and resistance near $91 is still active on the hourly chart (ETH/USD, data feed via SimpleFX).
- A break and close above the $91 level may call for sustained gains in the near term.
Ethereum price continues to trade in a range against the US Dollar and Bitcoin, but the underlying trend remains bullish for ETH/USD above $85.
Ethereum Price Range
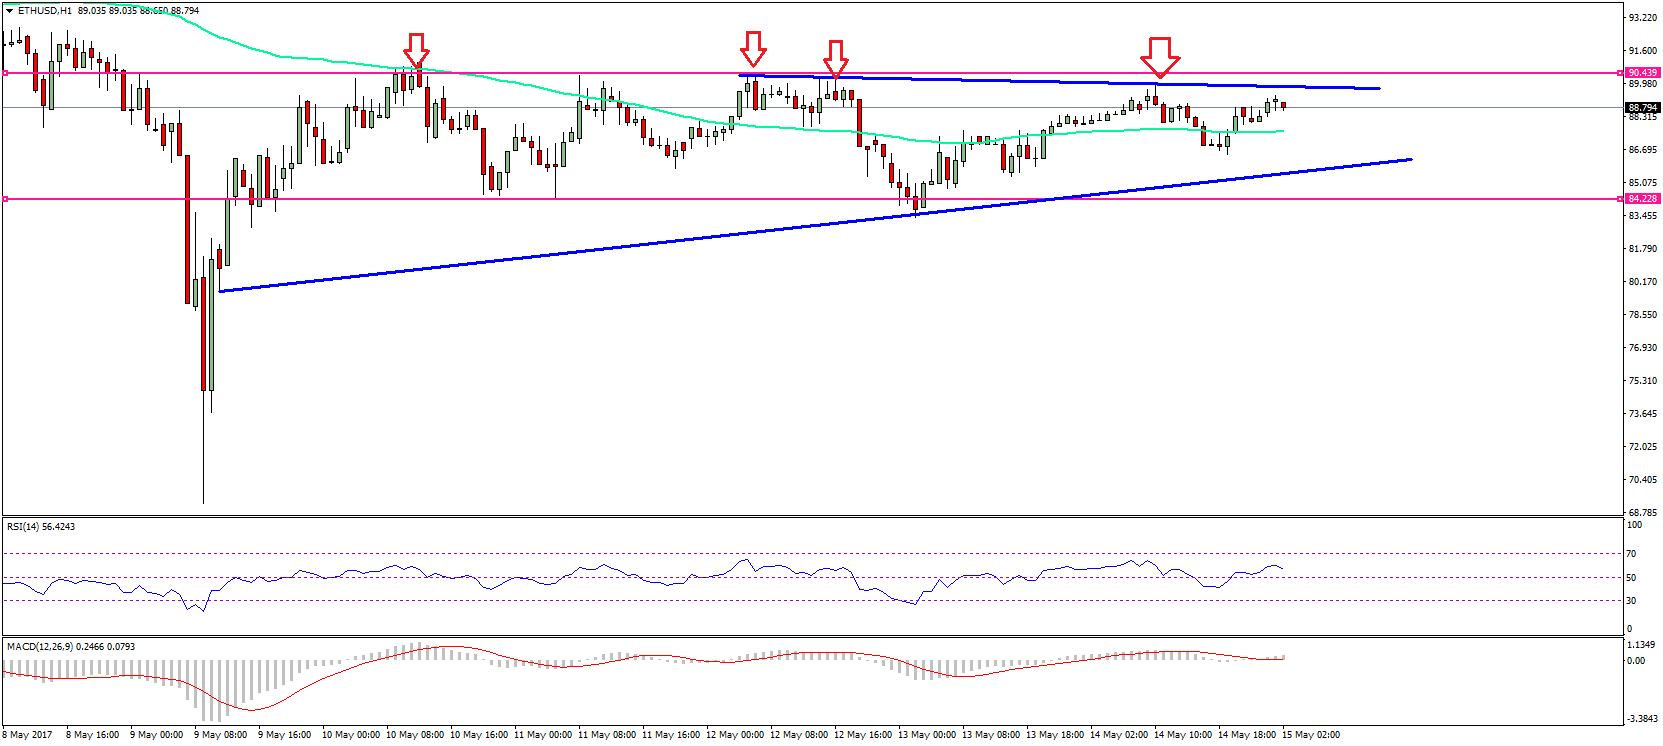
In the last analysis, we saw how ETH price formed a base near $86 against the US Dollar. There was also a major range pattern with support at $84.50 and resistance near $91 formed on the hourly chart of ETH/USD. The same range pattern is still active, and playing a major role. The price is currently well above the 100 hourly simple moving average at $88, which is a positive sign.
On the upside, the range resistance is near $91, which acted as a hurdle on many occasions. A break above it is needed for a move towards $100. On the downside, there is a connecting bullish trend line at $85.80 on the hourly chart. Below $85.80, there is a support near $84.20 which is the range support. It also coincides with the 38.2% Fib retracement level of the last wave from the $69.24 swing low to $90.98 high.
On the upside, we need a break above $91, but it won’t be easy. The current momentum is with buyers as long as the price is above $85. A break below the range support at $85 won’t be good, and may call for a change in the trend.
Hourly MACD – The MACD is not moving much, and suggesting a range pattern.
Hourly RSI – The RSI is just above the 50 level and moving higher.
Major Support Level – $85
Major Resistance Level – $91
Charts courtesy – SimpleFX