Key Highlights
- ETH price struggled and breached the $49.80 support area against the US Dollar.
- Yesterday’s highlighted bullish trend line with support at $49.90 was broken on the hourly chart (ETH/USD, data feed via SimpleFX).
- On the upside, the connecting bearish trend line is acting as a strong resistance near $49.80.
Ethereum price moved down below $49.80 against the US Dollar, and now ETH/USD looks poised to extend the decline in the short term.
Ethereum Price Resistance
There was a slight increase in the bearish pressure on ETH price, as it moved below $50.20 against the US Dollar. The price struggled and extended losses below $50. The most important break was below yesterday’s highlighted bullish trend line with support at $49.90 on the hourly chart (ETH/USD, data feed via SimpleFX). It prompted a move below the 38.2% Fib retracement level of the last wave from the $42.10 low to $53.69 high.
Later, the price traded close to the $48 handle and moved with a bearish structure. However, the 50% Fib retracement level of the last wave from the $42.10 low to $53.69 high managed to hold the downside. A major point to note here is the fact that the 100 hourly simple moving average is ignored near $48.80. The price is flirting with it and there is no close. On the upside, yesterday’s pointed connecting bearish trend line is now proving to be a strong resistance near $49. If the price continues to move higher, it could face sellers near $49.60.
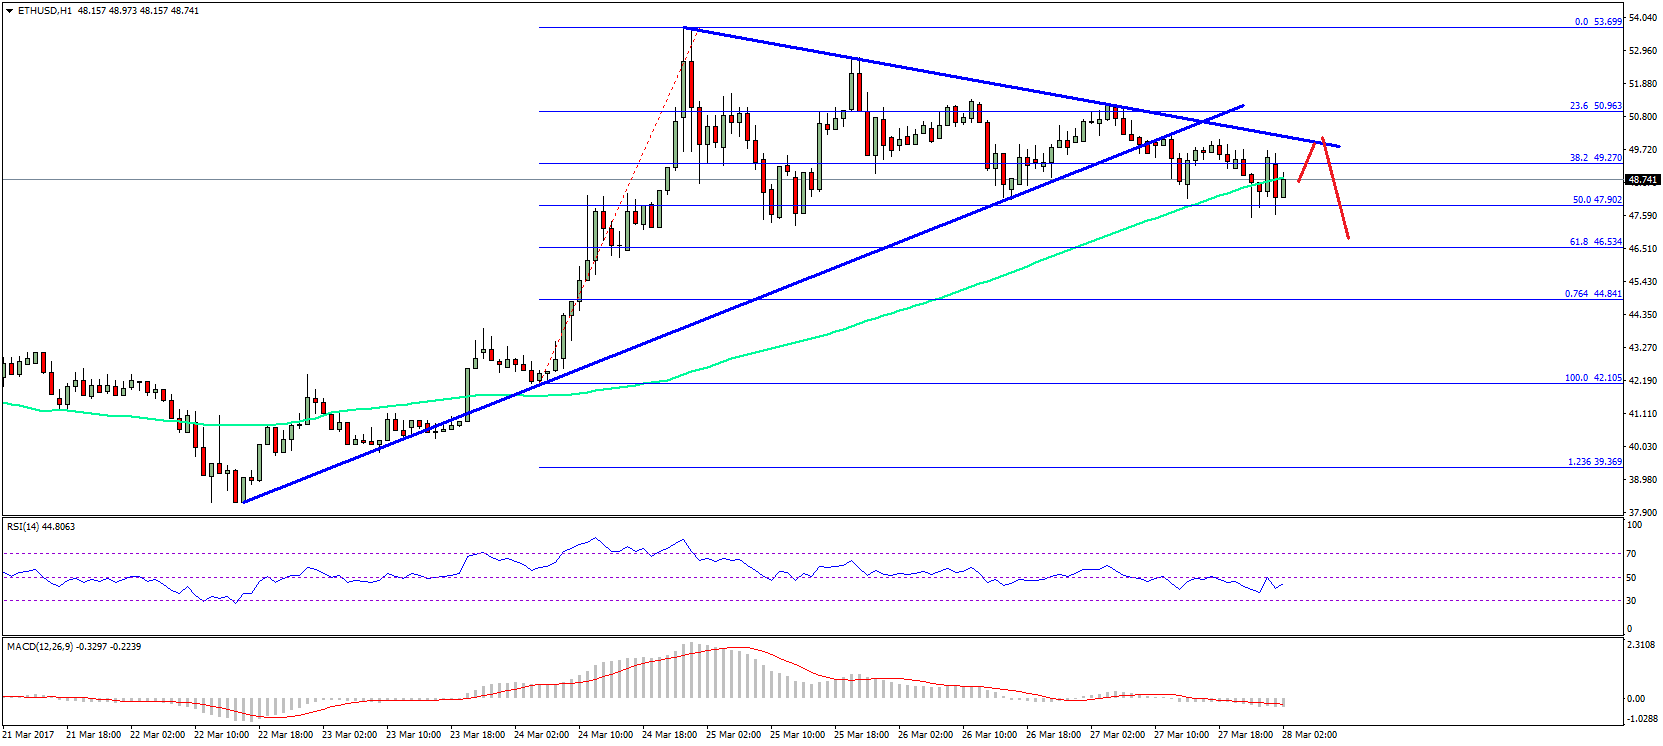
On the downside, a close below $48 could be a negative sign and might prompt more declines. The next support would be near the 61.8% Fib retracement level of the last wave from the $42.10 low to $53.69 high at $46.50.
Hourly MACD – The MACD is back in the bearish zone.
Hourly RSI – The RSI is struggling to move back above the 50 level.
Major Support Level – $48.00
Major Resistance Level – $49.60
Charts courtesy – SimpleFX