Key Highlights
- ETH price failed to hold the $290 support and declined towards $274 against the US Dollar.
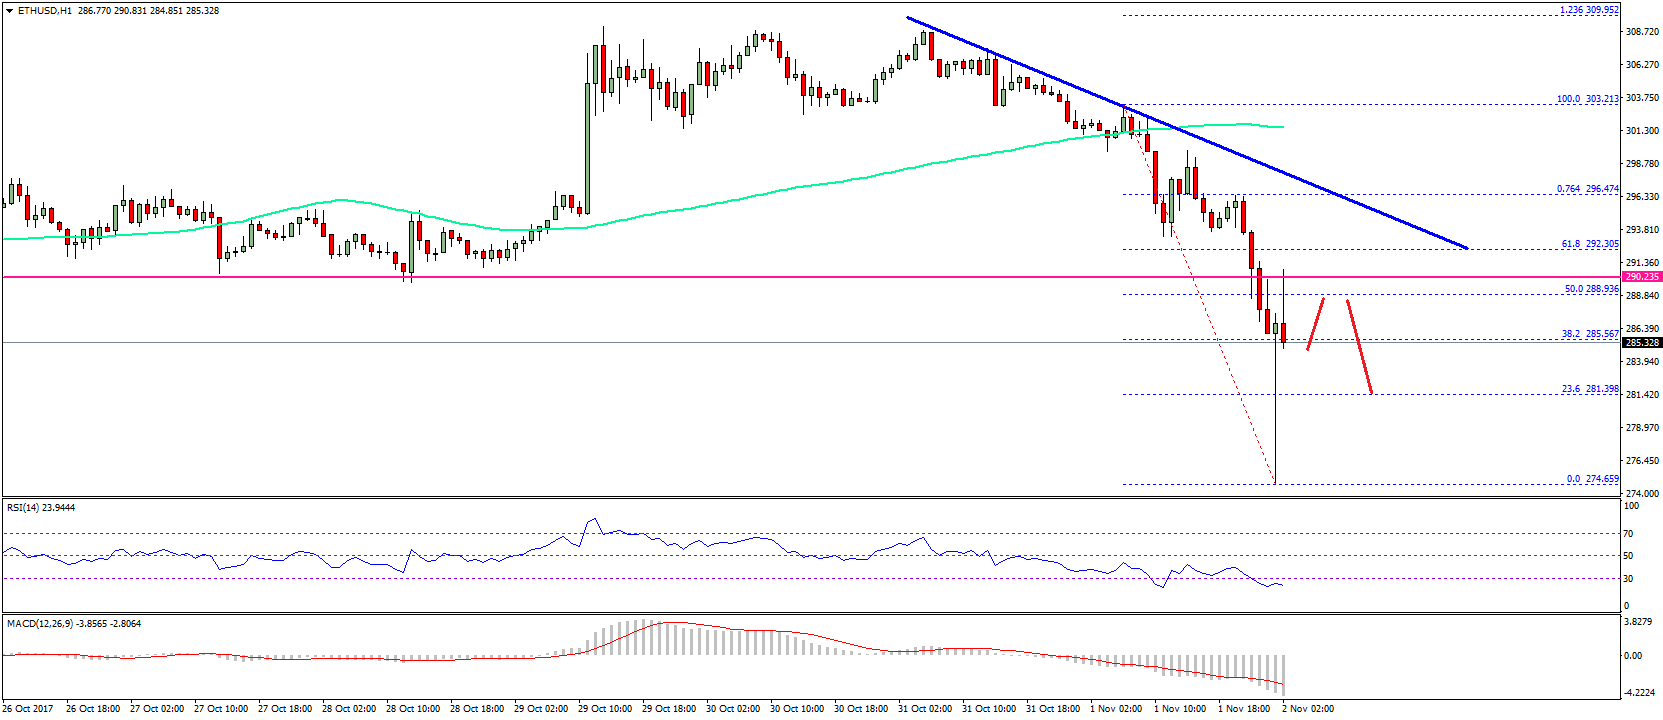
- There is a major bearish trend line forming with resistance at $292.50 on the hourly chart of ETH/USD (data feed via SimpleFX).
- The price is currently correcting higher, but upsides are likely to be capped by $290 and $292.
Ethereum price made a sharp downside move against the US Dollar and Bitcoin. ETH/USD is now below $290 and remains at a risk.
Ethereum Price Decline
There was no recovery in ETH price above the $300 level against the US Dollar. The price extended its decline and even broke a major support area near $290. It ignited further declines and the price even moved below the $280 level. A low was formed near $274.65 from where there was a sharp recovery. Buyers succeeded in pushing the price above the 38.2% Fib retracement level of the last decline from the $303.21 high to $274.65 low.
However, the upside move was protected by the $290 level. It was a support earlier and recently prevented the current recovery above $290. Moreover, the 50% Fib retracement level of the last decline from the $303.21 high to $274.65 low also acted as a resistance. To the upside, there is a major bearish trend line forming with resistance at $292.50 on the hourly chart of ETH/USD. The trend line resistance is near the 61.8% Fib retracement level of the last decline from the $303.21 high to $274.65 low.
Therefore, a break above $290 and $292 won’t be easy in the near term. On the downside, there is an open space up to $275-274. As long as the price is below $290, it would continue to move down.
Hourly MACD – The MACD is strongly placed in the bearish zone.
Hourly RSI – The RSI has reached the oversold levels with no signs of a recovery.
Major Support Level – $274
Major Resistance Level – $290
Charts courtesy – SimpleFX