Key Highlights
- ETH price remained below the $230-236 resistance area and failed to gain traction against the US Dollar.
- Yesterday’s highlighted bearish trend line with current resistance near $228 on the hourly chart of ETH/USD (data feed via SimpleFX) is still intact.
- The price has slowly moved below the 100 hourly SMA, but there is no major move below $230.
Ethereum price is struggling to gain bullish momentum against the US Dollar and Bitcoin, and ETH/USD remains capped by a major hurdle near $230-236.
Ethereum Price Resistance
During the past few days, there were only range moves in ETH price above the $205 level against the US Dollar. On the upside, the price struggled to break the $230 and $236 resistance levels. There was no major action during the past few sessions, and the price slowly moved below $228. It is now below the 100 hourly simple moving average and the 38.2% Fib retracement level of the last wave from the $208.10 low to $236.16 high.
On the upside, yesterday’s highlighted bearish trend line with current resistance near $228 on the hourly chart of ETH/USD is capping upside. It may continue to prevent gains unless buyers succeed in placing the price above $236-240. On the downside, an immediate support is around the 50% Fib retracement level of the last wave from the $208.10 low to $236.16 high at $222.13. However, there can be a reaction towards the $218 level, which is the 61.8% Fib level of the same wave.
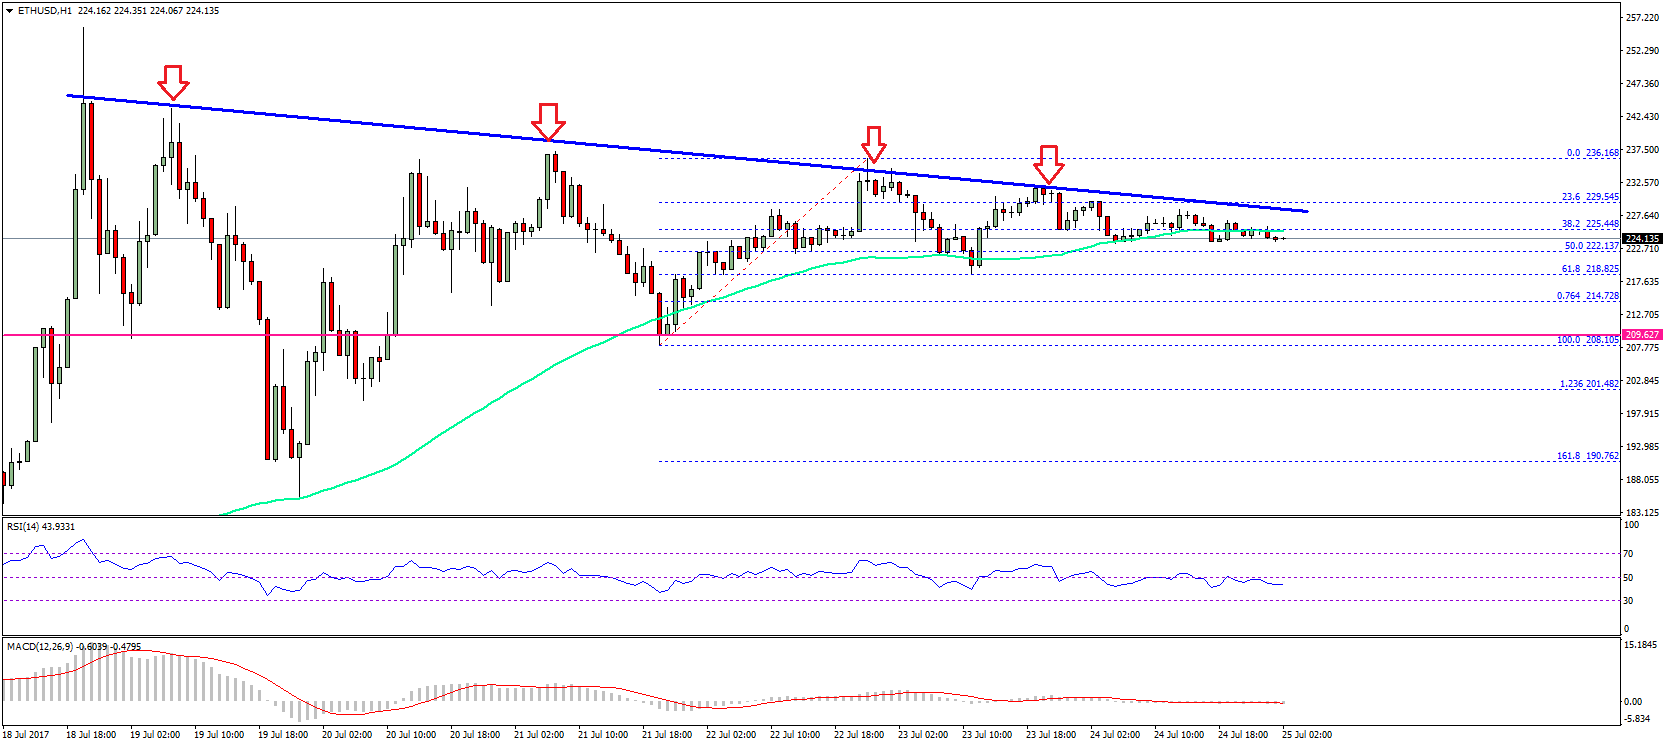
As long as there is no upside break above $236, we might continue to see ranging moves. On the downside, $218 and $205 levels can be considered as a decent support levels.
Hourly MACD – The MACD is almost flat, signaling no major move.
Hourly RSI – The RSI is currently just below the 50 level, but with no major direction.
Major Support Level – $218
Major Resistance Level – $236
Charts courtesy – SimpleFX