Key Highlights
- ETH price maintained its bullish bias against the US Dollar and closed above the $9.60 level.
- There was a break above a bearish trend line formed on the daily chart (data feed via SimpleFX) of ETH/USD, which earlier opened the gates for more gains.
- The price is also well above the 100-day simple moving average, which is a positive sign.
Ethereum price remained in an uptrend this past week against the US Dollar and Bitcoin, and ETH/USD may continue to trade higher.
Ethereum Price Upside Move
There was a slow and steady increase in Ehereum price against the US Dollar, as the price moved past the $9.60 resistance area. Later, the price also moved above the $10.00 level, which is a positive sign. Moreover, there was also a bearish trend line formed on the daily chart (data feed via SimpleFX) of ETH/USD. It was also broken during the upside move earlier this month, which opened the gates for more gains.
The best part was the close above the 100-day simple moving average. It is an encouraging sign, which means the price is well positioned above $10.00. The price recently moved down below the 23.6% Fib retracement level of the last wave from the $6.87 low to $11.41 high to ignite a downside move. However, the price later found support near the 50% Fib retracement level of the last wave from the $6.87 low to $11.41 high.
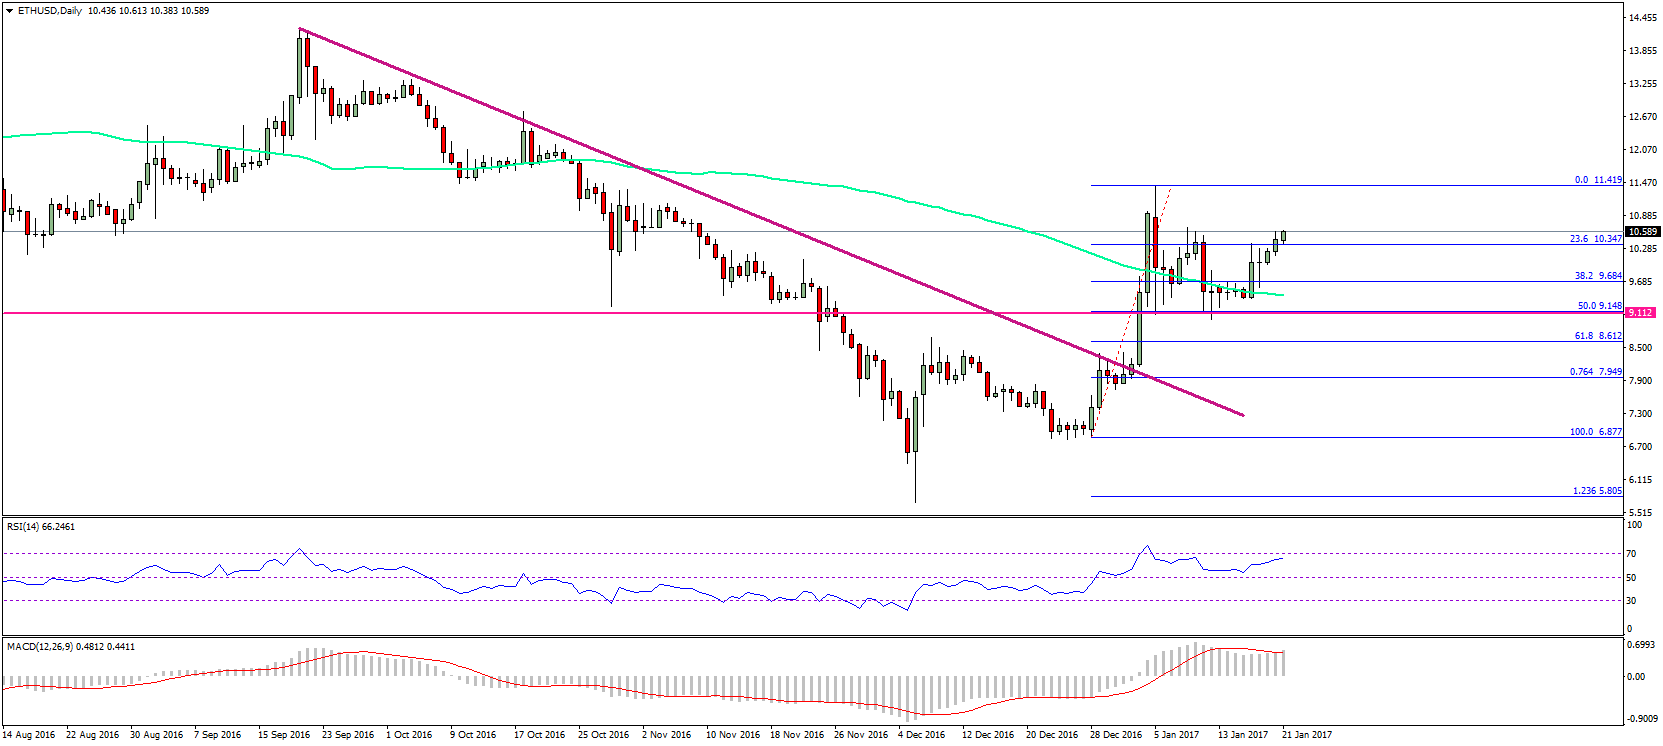
The price is now moving back higher, and currently trading above $10.00, which is a positive sign. It may lift the pair further and could take it above $11.00. Let us see how the price trades in the upcoming week, and whether it trades towards $12.00 or not.
Daily MACD – The MACD is still in the bullish zone, which is a good sign.
Daily RSI – The RSI is well above the 50 level, calling for more gains.
Major Support Level – $10.00
Major Resistance Level – $11.00
Charts courtesy – SimpleFX