Key Highlights
- ETH price did not move much from the $292 swing low against the US Dollar.
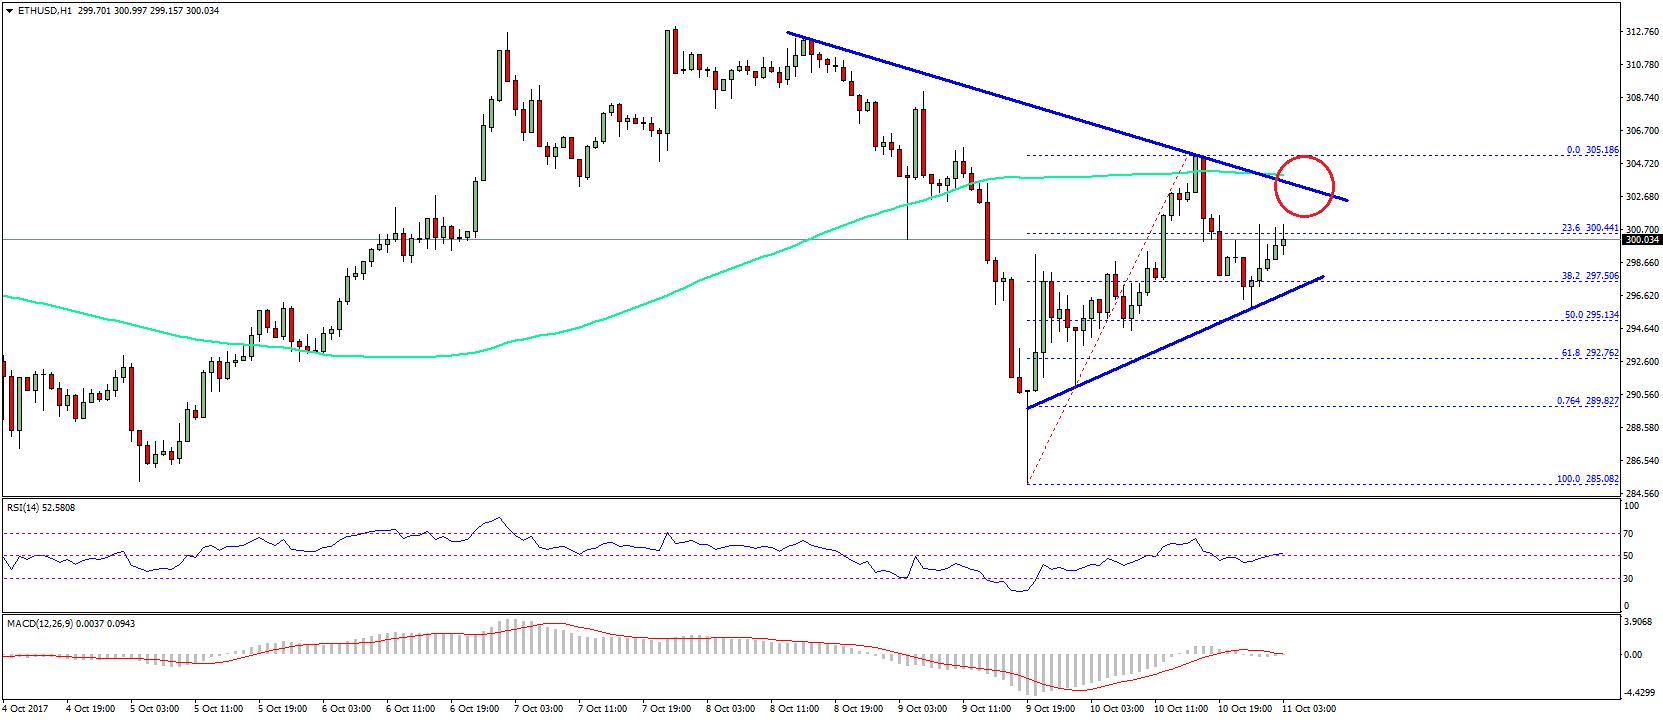
- There is a short-term contracting triangle forming with resistance at $302.50 on the hourly chart of ETH/USD (data feed via SimpleFX).
- On the downside, a short-term support is at $297.50, which can be seen as a daily pivot.
Ethereum price is moving in a range against the US Dollar and Bitcoin. ETH/USD might continue to trade below $310 in the short term before the next move.
Ethereum Price Short-term Breakout Pattern
There was not much of action in ETH price as it continued to trade below the $305-306 levels against the US Dollar. The price recovered well from the $285.08 low and attempted a break above the $305 resistance. However, buyers failed to push the price above $305 and the 100 hourly simple moving average. As a result, there was a downside move below the 23.6% Fib retracement level of the last wave from the $285.08 low to $305.18 high.
The price even broke the $300 level and traded towards the 50% Fib retracement level of the last wave from the $285.08 low to $305.18 high. It found bids near $296 and is currently recovering. At the moment, there is a short-term contracting triangle forming with resistance at $302.50 on the hourly chart of ETH/USD. The triangle resistance is near $302 and the 100 hourly simple moving average. Therefore, an upside break above $303 in the short term won’t be easy.
On the downside, today’s support is at $295-296. A close below $295 would call for a test of $290 or even $285. Overall, there can be more ranging moves before the price makes the next move towards $310.
Hourly MACD – The MACD is flat in the bearish zone.
Hourly RSI – The RSI is currently just near the 50 level.
Major Support Level – $295
Major Resistance Level – $303
Charts courtesy – SimpleFX