Key Highlights
- ETH price declined recently and broke the $280 support against the US Dollar to trade as low as $274.84.
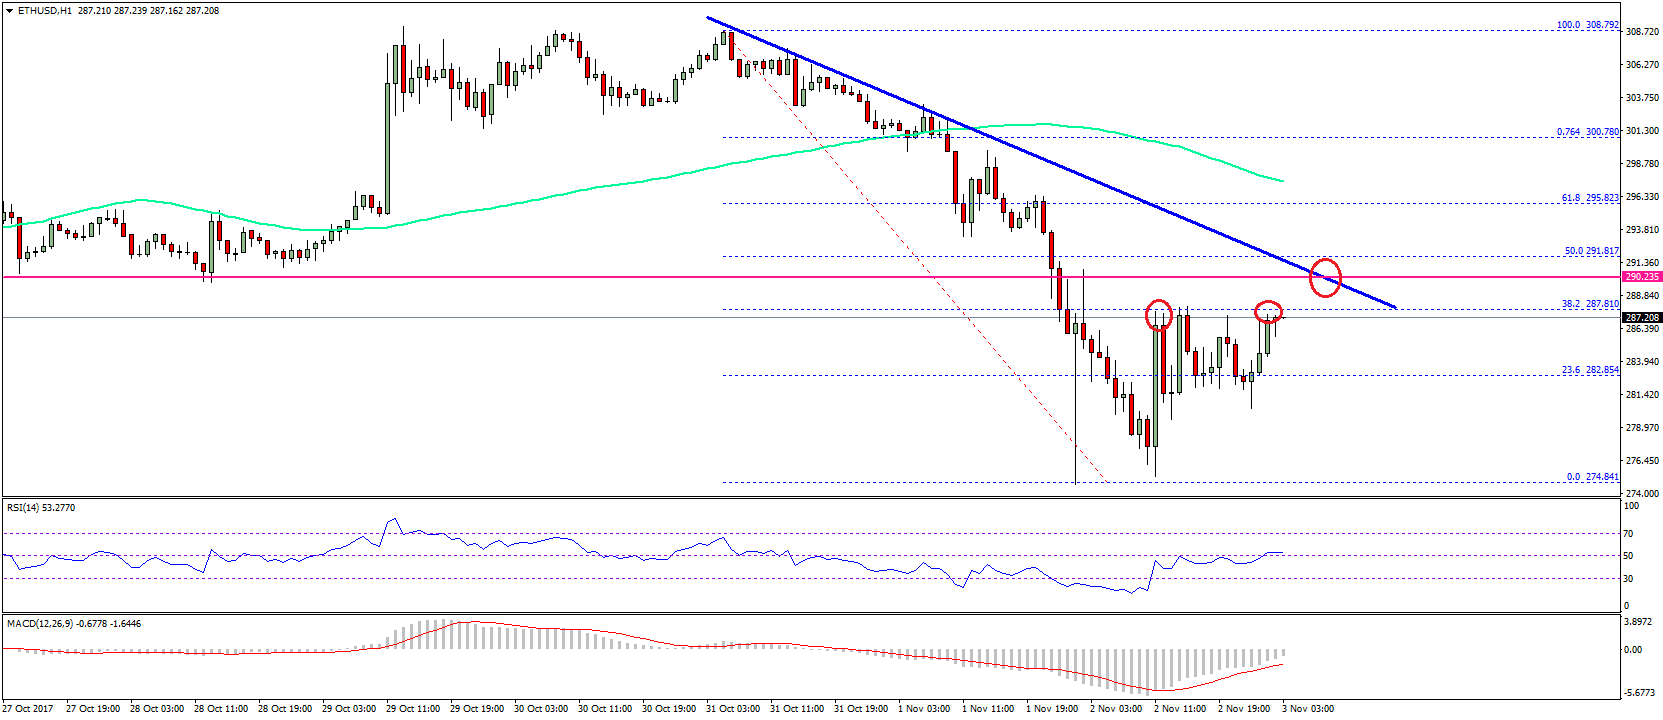
- Yesterday’s highlighted major bearish trend line with current resistance at $290.50 is intact on the hourly chart of ETH/USD (data feed via SimpleFX).
- The price is moving higher, but most likely to find sellers near the $290.50-291.00 levels.
Ethereum price remains in the bearish zone against the US Dollar and Bitcoin. ETH/USD’s upsides are capped by the $290 and $291 levels.
Ethereum Price Resistance
There was no respite for ETH price as it moved below the $285 and $280 support levels against the US Dollar. The price declined sharply and traded to a new monthly low at $274.84. Later, buyers succeeded in preventing further declines below $274 and the price started a short-term correction. It moved above the 23.6% Fib retracement level of the last decline from the $308.79 high to $274.84 low.
However, the upside move is currently finding sellers near $287.50. The mentioned $287.50 level prevented a break on 2-3 times recently. It also represents the 38.2% Fib retracement level of the last decline from the $308.79 high to $274.84 low. Above $287.50, the next hurdle is near yesterday’s highlighted major bearish trend line with current resistance at $290.50 on the hourly chart of ETH/USD. Moreover, the 50% Fib retracement level of the last decline from the $308.79 high to $274.84 low is near $291.81.
Therefore, there are many hurdles on the way up starting from $287.50 up to $291.80. A proper close above $292 is needed for buyers to step up the momentum. On the downside, the $280 level is an initial support followed by the recent low of $274.84.
Hourly MACD – The MACD has reduced most of its bearish slope.
Hourly RSI – The RSI is attempting to move above the 50 level and showing positive signs.
Major Support Level – $274
Major Resistance Level – $290
Charts courtesy – SimpleFX