Key Highlights
- ETH price is under pressure and moved below the $302 support against the US Dollar.
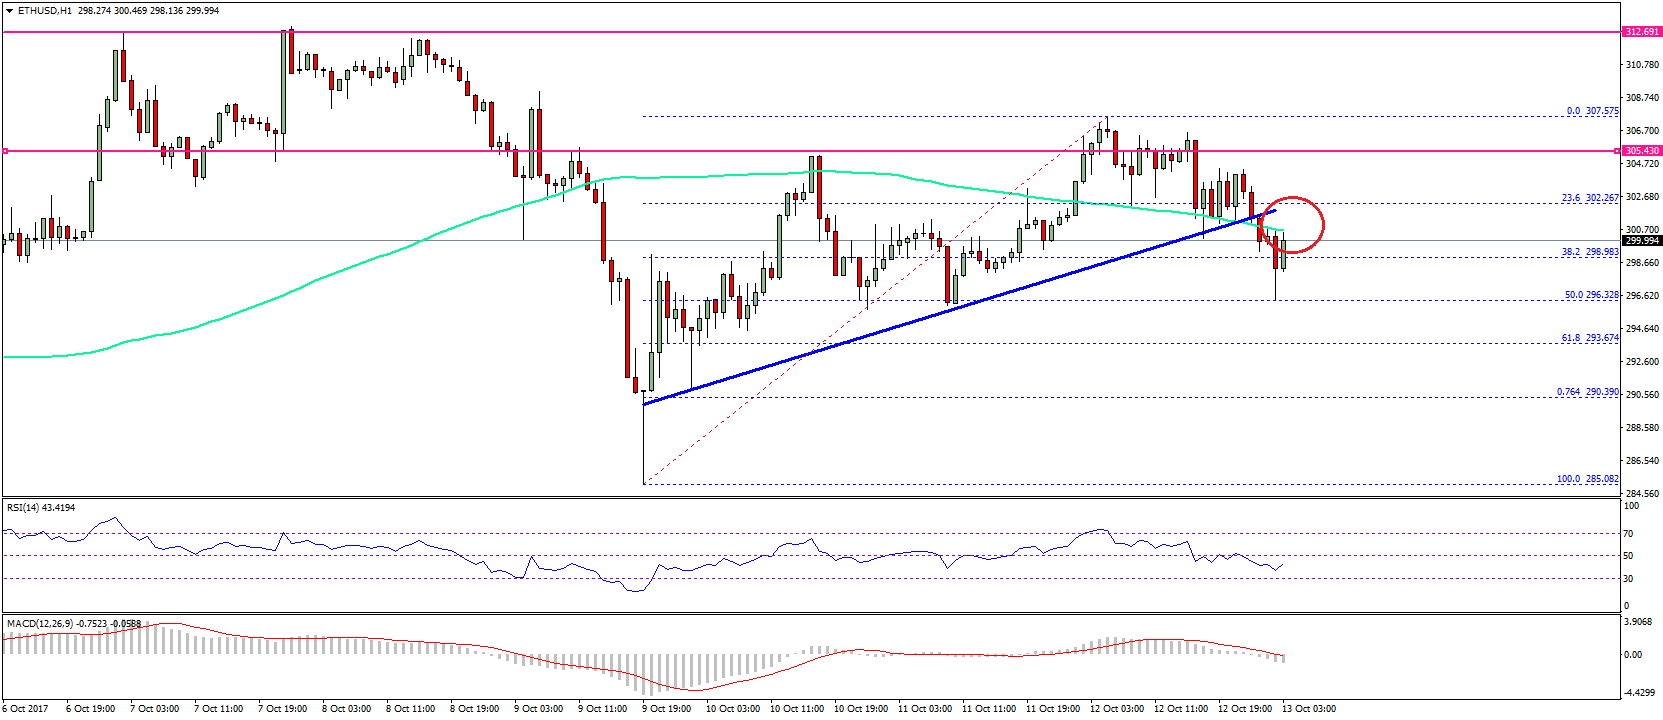
- There was a break below a bullish trend line with support at $302 on the hourly chart of ETH/USD (data feed via SimpleFX).
- The price is now below the 100 hourly simple moving average, but remains supported above $296.50.
Ethereum price is under pressure against the US Dollar and Bitcoin. ETH/USD might correct a few points, but remains supported above $296.
Ethereum Price Support
There was a sharp rise in bitcoin price, which is putting pressure on ETH price below $305 against the US Dollar. The price failed to gain momentum above $307.50 and started a downside move. It broke the 23.6% Fib retracement level of the last wave from the $285.08 low to $307.57 high. The most important break was below a bullish trend line with support at $302 on the hourly chart of ETH/USD. It opened the doors for more losses below $302.
The pair declined and tested the 50% Fib retracement level of the last wave from the $285.08 low to $307.57 high. It has moved below the 100 hourly simple moving average, but remains supported above $296.50. It might recover from the current levels, but has to move back above $300 and 100 hourly SMA to gain traction. On the upside, the pair needs to clear offers near $304 and $306 to move back in the bullish zone.
If the pair fails to move pass $302 and 100 hourly SMA, the $296.50 support might be tested. The next support is around the 61.8% Fib retracement level of the last wave from the $285.08 low to $307.57 high. The overall bias is neutral until bitcoin price settles down.
Hourly MACD – The MACD has moved into the bearish zone.
Hourly RSI – The RSI is currently below the 50 level.
Major Support Level – $296
Major Resistance Level – $304
Charts courtesy – SimpleFX