
Key Highlights
- ETH price managed to pop higher during the end of this past week against the US Dollar.
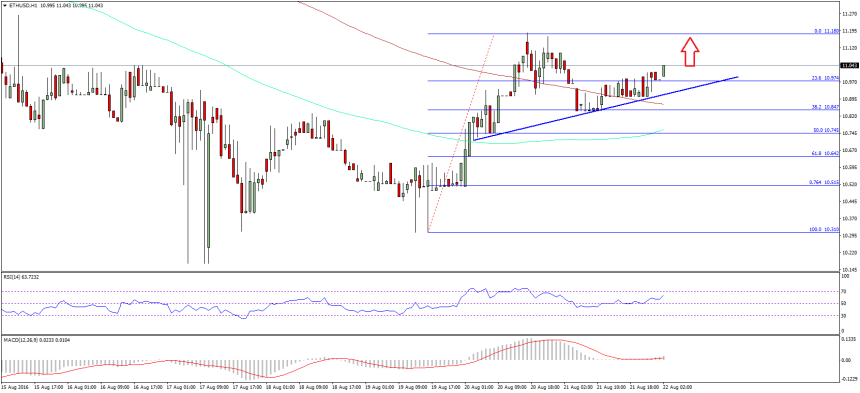
- There is a minor bullish trend line formed on the hourly chart (data feed via SimpleFX) of ETH/USD, which can be seen as a support area.
- The price is also above the 100 hourly simple moving average, which is a positive sign.
Ethereum price gained recently versus the USD, and it looks like the technical indicators are aligning for more gains in ETH.
Ethereum Price Support
Ethereum price ETH after struggling for a brief period started to show some positive signs against the US dollar and traded higher. There was a move from the $10.20 support area and close above the $10.80 resistance zone. During the recent upside move the price cleared a couple of important resistances, including the 100 hourly simple moving average.
The price recently traded as high as $11.18 where it found sellers and started correcting lower. The price corrected towards the 38.2% Fib retracement level of the last wave from the $10.31 low to $11.18 high. It found support and now moving back higher. Moreover, there is a minor bullish trend line formed on the hourly chart (data feed via SimpleFX) of ETH/USD. It is acting as a support zone, and can be considered as a buying area in the near term.
As long as the price is above the $10.50 level, there is a chance of a move above the recent high of $11.18. In my view, the current trend is positive for the ETH/USD pair, and may take it further higher. The technical indicators are also signaling more gains in ETH going forward.
Hourly MACD – The MACD is back in the bullish zone, which is a positive sign.
Hourly RSI – The RSI is now above the 50 level, and calling for more gains in ETH.
Major Support Level – $10.50
Major Resistance Level – $11.20
Charts courtesy – SimpleFX