Key Highlights
- Ethereum price traded down one more time against the US Dollar, but the last low of $10.13 acted as a perfect support area.
- Yesterday’s highlighted contracting triangle pattern on the hourly chart (data feed via Kraken) of ETH/USD was broken during the downside move.
- The price is still below the upper trend line, which needs to be broken before the price can move higher.
Ethereum price is fighting hard, but it won’t be an easy task for the ETH bulls. Only a break and close above $13.00 may call for a bullish move.
Ethereum Price Resistance
Ethereum price ETH traded lower once again, as the bulls failed to hold gains. Yesterday’s highlighted contracting triangle pattern on the hourly chart (data feed via Kraken) of ETH/USD was broken to ignite the downside move.
The price traded closer to the last swing low of $10.13 where it managed to find bids, and there is also a bullish candle formed around the same level. The price is trading higher, but facing resistance near the triangle upper trend line, which is acting as a hurdle for the ETH bulls. As long as the price is below the trend line, it won’t be easy for ETH to gain further.
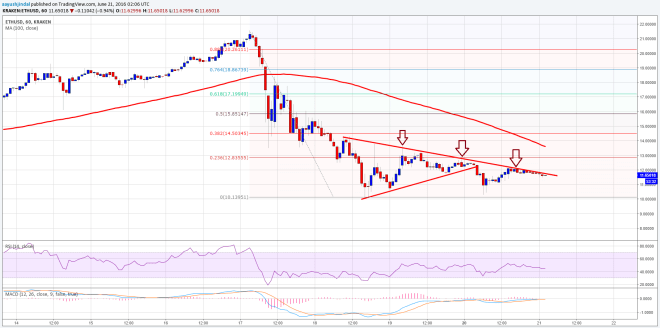

Moreover, the 23.6% Fib retracement level of the last drop from the $21.10 high to $10.13 low is also intact, which can be considered as another resistance on the upside. If you are positive, then you can even consider buying with a break of the trend line resistance, but with a stop of not more than 1-2 points.
Hourly MACD – The MACD is mostly flat, suggesting that the price may trade in a range for some time.
Hourly RSI – The RSI has moved below the 50 level, which is not a good sign in the short term.
Major Support Level – $10.15
Major Resistance Level – $12.40
Charts courtesy of Kraken via Trading View