Key Highlights
- ETH price remained under pressure against the US Dollar, as buyers failed to gain momentum.
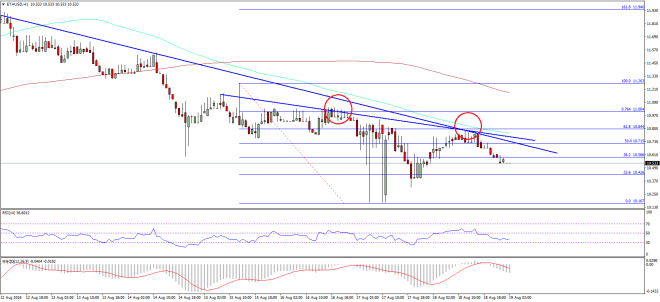
- There are a couple of important bearish trend lines formed on the hourly chart (data feed via SimpleFX) of ETH/USD, which are preventing gains.
- It looks like buyers are finding it really hard to take the price higher, but sooner or later they will.
Ethereum price ETH popped a few points higher versus the USD, but failed once again to sustain momentum, and traded lower.
Ethereum Price Hurdles
Ethereum price ETH struggled to move higher against the US Dollar continued. The ETH bulls somehow managed to take the price from $10.16 to $10.84, but they found many hurdles on the upside. As a result, there was as downside move. There are a couple of important bearish trend lines formed on the hourly chart (data feed via SimpleFX) of ETH/USD.
These trend lines acted as a resistance on many occasions, and the recent failure around $10.80 was also due to them. The most important point is that the 100 hourly simple moving average is now positioned just above these trend lines. It means the highlighted resistance holds the key for more gains in ETH. Only if the ETH bulls manage to break, there is a chance of a move higher. Moreover, the 50% Fib retracement level of the last drop from the $11.26 high to $10.16 low may also act as a hurdle on the upside.

No doubt, the ETH/USD pair is in a downtrend, but I see some signs of exhaustion. It’s just that the ETH buyers are not getting any catalyst to take the price higher in the short term.
Hourly MACD – The MACD is back in the bearish zone, which is not a good sign.
Hourly RSI – The RSI is again below the 50 level, and signaling weakness in ETH.
Major Support Level – $10.40
Major Resistance Level – $10.80
Charts courtesy – SimpleFX