

Key Highlights
- Ethereum price after a couple of failures to test the $15.00 level vs the US dollar traded lower.
- I stated yesterday that these failures are not good and pay push the price down in the short term.
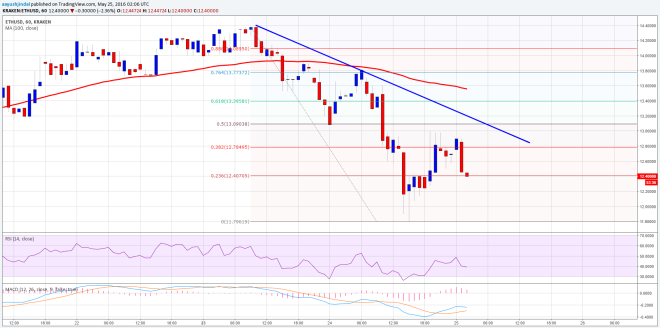
- There is a now a bearish trend line formed on the hourly chart (data feed via Kraken) of ETH/USD, which may act as a resistance if the price moves higher.
Ethereum price traded below $12.00 intraday, and currently attempting to move higher once again, but it may find sellers near $13.00.
Ethereum Price Changed Trend?
Ethereum price ETH was in a strong uptrend for almost a week vs the US dollar and bitcoin. However, it looks like there is a minor top in place for ETH, and it may trade down further moving ahead. ETH/USD broke a major support area around the $13.00 level, which may now act as a resistance if the price moves higher.
There is a bearish trend line formed on the hourly chart (data feed via Kraken) of ETH/USD, which may play a major role in the short term. The price after trading as low as $11.80 corrected higher. However, it failed near the 38.2% Fib retracement level of the last drop from the $14.40 high to $11.79 low. A very important resistance on the upside is near the trend line, as it is also coinciding with the 50% Fib retracement level of the same drop.

Yesterday’s idea of selling ETH/USD played well, and if you entered into a trade I hope you closed it with gains. I think we can consider selling more as long as the price is below the $13.00-$13.10 levels with a stop above it.
Hourly MACD – The MACD may change the slope to the bearish zone, calling for more losses.
Hourly RSI – The RSI is below the 50 level, which is a bearish sign.
Intraday Support Level – $12.00
Intraday Resistance Level – $13.00
Charts courtesy of Kraken via Trading View
Header Image via NewsBTC