Key Highlights
- ETH price surged higher against the US Dollar and broke many important resistance levels on the way up.
- After trading as high as $12.50, the price corrected lower.
- Yesterday’s highlighted bullish trend line on the hourly chart (data feed via SimpleFX) of ETH/USD provided support during the downside and protected losses
Ethereum price registered solid gains versus the US Dollar yesterday and currently correcting lower to gain bids on the downside.
Ethereum Price Correction
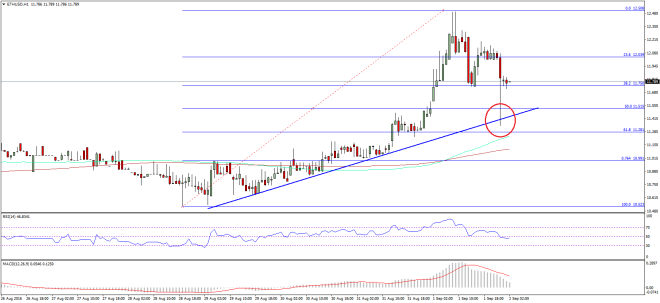
Ethereum price ETH as mentioned climbed as high as $12.50 against the US Dollar where it found sellers for a minor correction. The price did correct lower and moved below the 23.6% Fib retracement level of the last leg from the $10.53 low to $12.50 high. However, the downside was limited, as there were a few important support levels on the downside.
First, yesterday’s highlighted bullish trend line on the hourly chart (data feed via SimpleFX) of ETH/USD acted as a support. Second, the 50% Fib retracement level of the last leg from the $10.53 low to $12.50 high provided bids. The price recovered well after testing the trend line support area and now back above $11.50. It looks like the price may head higher once again but depends on the market sentiment.

There may be another dip as well, but as long as the trend line support is intact, the price remains in an uptrend. The price is also above the 100 hourly simple moving average, which is a positive sign. No doubt, the recent upside move was positive, and may keep taking ETH higher. We just need to keep an eye on the support junctions for bids.
Hourly MACD – The MACD is about to move into the bearish zone, calling for a correction.
Hourly RSI – The RSI just moved below the 50 level, which means there can be another dip.
Major Support Level – $11.50
Major Resistance Level – $12.00
Charts courtesy – SimpleFX