

Key Highlights
- Ethereum price spiked higher vs the US Dollar intraday and appreciated by more than 10%.
- Yesterday’s bullish trend line on the hourly chart (data feed via Kraken) of ETH/USD played well, as the price bounced perfectly after testing it.
- There is a chance of a minor correction from the current levels, which can be seen as a buying opportunity.
Ethereum price traded above the $11.00 handle vs the USD, and it looks like there are more upsides left in ETH/USD in the near term.
Ethereum Price – Buying Dips?
Ethereum price ETH as mentioned bounced during the past couple of sessions vs the US Dollar and traded above the $11.00 level. There was a lot of buying interest noted for ETH, which may continue in the near term. Yesterday, I highlighted a bullish trend line on the hourly chart (data feed via Kraken) of ETH/USD. It played well and helped the bulls to gain bids.
As soon as the price settled above the 100 hourly simple moving average, there was a sharp upside move. Moving ahead, there are many signs on the hourly MACD and RSI of a correction in the short term. So, the price may move down a few points before it can continue trading higher. On the downside, an immediate support lies at 23.6% Fib retracement level of the last wave from the $10.00 low to $11.40 high.
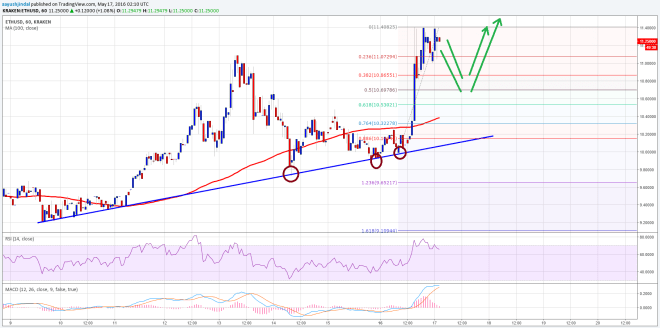

However, if the correction is extended, then a move towards the 50% Fib retracement level of the last wave from the $10.00 low to $11.40 high is also possible, which can act as a major support area for ETH/USD.
Hourly MACD – The MACD is in the about to change the slope to bearish, calling for a correction.
Hourly RSI – The RSI is around the overbought levels, which means there is a chance of it moving down.
Intraday Support Level – $11.00
Intraday Resistance Level – $11.40
Charts courtesy of Kraken via Trading View
Image: NewsBTC