Key Highlights
- ETH price moved higher recently against the US Dollar, and traded close to the $10.55 level.
- Yesterday’s highlighted bearish trend line on the hourly chart of ETH/USD (data feed via SimpleFX) was broken at $10.25-10.30 for an upside move.
- The price is now back lower, but may find support near $10.30-10.25.
Ethereum price managed to move above the $10.30 resistance against the US Dollar, which is a positive sign for the ETH/USD buyers in the near term.
Ethereum Price Resistance
Yesterday, we saw how ETH price was struggling to clear the $10.25-10.30 resistance against the US Dollar. Later, the price gained strength and somehow managed to break the $10.30 resistance. The upside was so strong that the price also cleared the 50% Fib retracement level of the last decline from the $10.47 high to $10.20 low. Moreover, the price also settled above the 100 hourly simple moving average at $10.28, opening the doors for more gains.
Lastly, the price also moved past yesterday’s highlighted bearish trend line on the hourly chart of ETH/USD (data feed via SimpleFX) at $10.25. So, there was a good bullish wave towards the $10.55 level where sellers appeared. The price once again started trading lower and moved below $10.40. There was also a break below the 38.2% Fib retracement level of the last wave from the $10.20 low to $10.52 high.
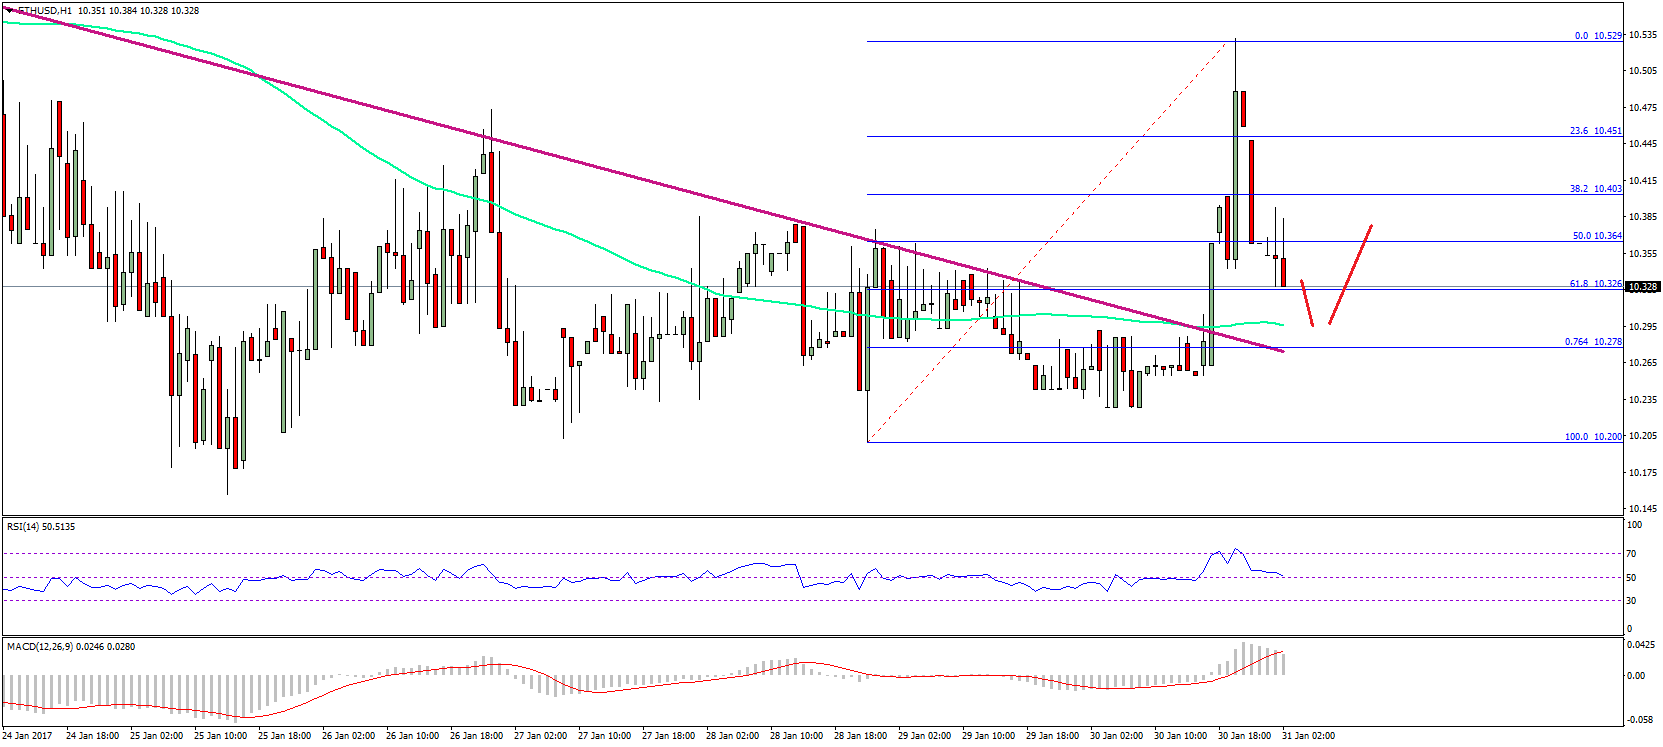
However, the last resistance at $10.25-10.30 may now act as a support. It also coincides with the 76.4% Fib retracement level of the last wave from the $10.20 low to $10.52 high. Overall, the price is back down, but might gain bids near $10.25-10.30 in the short term.
Hourly MACD – The MACD is in the bullish slope, but slowly the momentum is fading and changing.
Hourly RSI – The RSI is heading towards the 50 level where it may find support.
Major Support Level – $10.30
Major Resistance Level – $10.50
Charts courtesy – SimpleFX