Key Highlights
- ETH price collapsed yesterday against the US Dollar due to a reported EXP attack.
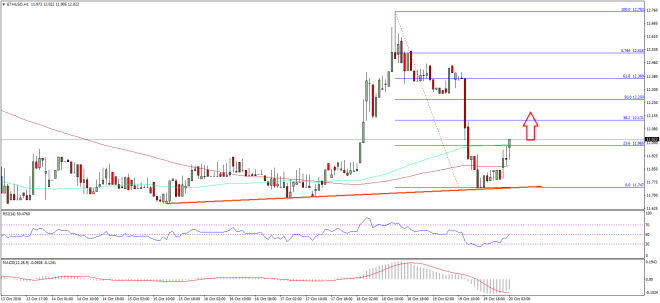
- There was a crucial bullish trend line on the hourly chart (data feed via SimpleFX) of ETH/USD, which managed to protect the downside move.
- The price is now recovering, and may attempt to settle above the 100 hourly simple moving average.
Ethereum price after nosediving towards the $11.80 level found support and currently attempting to recover in the near term.
Ethereum Price Support
Yesterday, there was a reported attack, which ignited a sharp downside move in Ethereum price. The ETH/USD pair nosedived and traded towards the last swing low of $11.80. The price also moved below the 50% Fib retracement level of the last leg from the $11.69 low to $12.75 high, which ignited further downsides. The pair also moved below the 100 hourly simple moving average, which encouraged bears to remain in the action.
However, buyers somehow managed to protect the downside move around the $11.80 level. There was a crucial bullish trend line on the hourly chart (data feed via SimpleFX) of ETH/USD, which acted as a support and stopped downsides. The pair is now recovering, and already moved above the 23.6% Fib retracement level of the last leg from the $12.75 high to $11.74 low. However, there is no hourly close above the 100 hourly simple moving average yet, but there are positive signs emerging on the chart.

If there is an hourly close above the 100 hourly simple moving average, then a move towards the 50% Fib retracement level of the last leg from the $12.75 high to $11.74 low is possible.
Hourly MACD – The MACD is currently in the bearish zone, and slowly attempting to reduce the pressure.
Hourly RSI – The RSI is currently below the 50 level, and attempting for a break higher above the stated level.
Major Support Level – $11.80
Major Resistance Level – $12.10
Charts courtesy – SimpleFX