Key Highlights
- Ethereum price finally managed to gain traction and traded higher vs the US dollar.
- ETH/USD broke a consolidation pattern and traded above a major resistance area of $14.00.
- Yesterday’s highlighted bearish trend line on the hourly chart (data feed via Kraken) of ETH/USD was also broken to open the gates for more upsides.
Ethereum price managed to break a crucial resistance area against the USD, which may now act as a support in the short term.
Ethereum Price Buy
Ethereum price ETH showed a few bullish signs during the past few hours and managed to pop higher not only against the US dollar, but also against other currencies. The most important point is the fact that the price moved above a major resistance area of $14.00, which acted as a hurdle for the ETH bulls on many occasions and may act as a support now if ETH/USD moves down from the current levels.
I highlighted and followed a bearish trend line on the hourly chart (data feed via Kraken) of ETH/USD, which was also cleared during the upside move. Moreover, the 100 hourly simple moving average was also breached by the ETH bulls during the rise. So, the price settled above a crucial resistance area, which can now be considered as a buy zone.
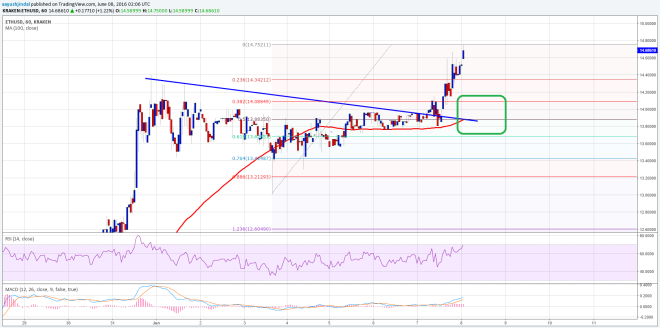

If you are looking to enter a buy trade, then consider it as long as the price is above the 100 hourly SMA. On the upside, the greatest challenge for ETH/USD remains around the $15.00 level, which acted as a barrier on many times, and it would be interesting to see how the price reacts this time.
Hourly MACD – The MACD is in the bullish zone, but may tilt in the bearish zone to ignite a minor correction.
Hourly RSI – The RSI is around the overbought levels, calling for a small downside move in the form of a correction.
Intraday Support Level – $14.20
Intraday Resistance Level – $14.80
Charts courtesy of Kraken via Trading View