Key Highlights
- Ethereum price collapsed against the US Dollar and even created a new low below $11.00 (as per Kraken data feed).
- Yesterday’s bearish trend line on the hourly chart (data feed via Kraken) of ETH/USD acted as a perfect resistance and pushed the price down.
- The price after trading below $11.00 recovered well and currently above the $11.20 support area.
Ethereum price spiked down to complete a downside thrust against the US Dollar. Can it recover or will it continue to trade down?
Ethereum Price Resistance
Ethereum price continued to move down versus the US Dollar, as the ETH/USD pair traded below the $11.00 area. There was a sharp downside move looking at the hourly chart candles, as yesterday’s bearish trend line on the hourly chart (data feed via Kraken) of ETH/USD acted as a perfect barrier for the upside move.
My yesterday’s idea of a sell trade was correct, and my view of more losses in ETH/USD paid off. Going forward, I think one needs to be very careful if planning to sell ETH. I think there are high chances of a recovery in the near term. However, in order for the price to move higher, it needs to break the highlighted trend line and resistance area. Moreover, the 100 hourly simple moving average is also positioned on the upside to stall the upside move in ETH/USD.
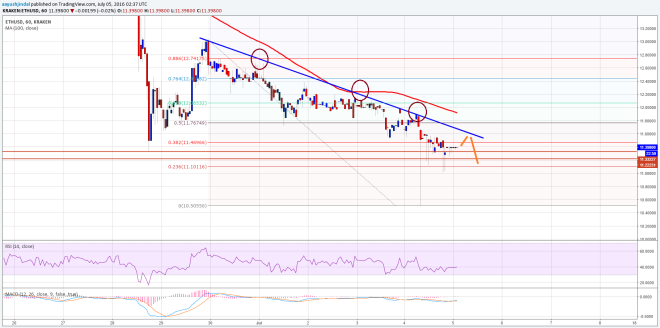

In order for the price to start a recovery, it has to close above the 50% Fib retracement level of the last drop from the $13.00 high, and close above the 100 hourly SMA. I think one must wait for some time before planning to trade in the short term.
Hourly MACD – The MACD is moving into the bullish slope, which can be an initial sign of a recovery.
Hourly RSI – The RSI is still below the 50 level, which is a divergence signal.
Major Support Level – $11.00
Major Resistance Level – $12.00
Charts courtesy of Kraken via Trading View