Key Highlights
- Ethereum price continued to tumble against the US Dollar, as there was a nasty decline in ETH/USD.
- Yesterday’s highlighted bearish trend lines on the hourly chart (data feed via Kraken) of ETH/USD played well in pushing the pair down.
- I remain bearish in the short term on ETH/USD as long as I don’t see good signs of a reversal.
Ethereum price remained under pressure against the US Dollar as there was an increase in seller’s strength, taking the price below $10.00.
Ethereum Price Collapse
Ethereum price ETH tumbled further yesterday, and my view of additional declines paid off. There was a sharp decline noted in the ETH/USD pair, which took it below the $10.00 level. A new weekly low of around $7.0 was formed, which is quite interesting in terms of decline. My yesterday’s highlighted bearish trend lines on the hourly chart (data feed via Kraken) of ETH/USD proved correct and acted as a resistance.
The price after trading as low as $7.09 started to correct higher against the US dollar, and managed to settle above the 23.6% Fib retracement level of the last decline from the $10.67 high to $7.09 low. However, it won’t be easy for the ETH/USD bulls to take the pair further higher. There is another bearish trend line waiting on the same chart on the upside to act as a resistance.
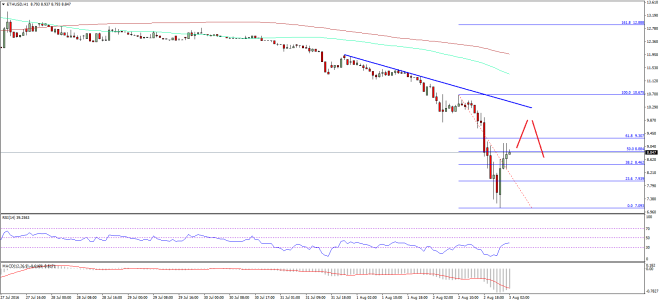

Moreover, the 61.8% Fib retracement level of the last decline from the $10.67 high to $7.09 low would act as a major barrier for a recovery. It would be interesting to see how the sellers react if the price continues to correct higher and tests the $9.80-$10.00 levels since it may act as a resistance area.
Hourly MACD – The MACD is strongly bearish, and continuing to signal further losses.
Hourly RSI – The RSI bounced from the oversold readings, but remains below the 50 level.
Major Support Level – $8.00
Major Resistance Level – $9.80
Charts courtesy – SimpleFX