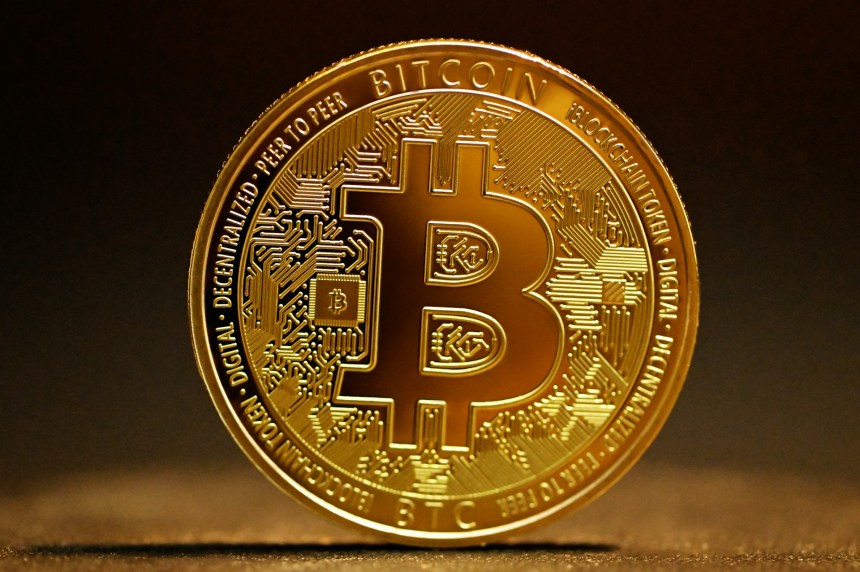


As the first-ever and most valuable cryptocurrency by market cap, Bitcoin continues to dominate headlines and shape the trajectory of the entire crypto market. Keeping a pulse on reputable Bitcoin news is paramount for traders, investors, and enthusiasts alike, as it provides valuable insights into market sentiment, price movements, and the overarching trends influencing this groundbreaking financial technology.
However, Bitcoin news today is not solely restricted to price fluctuations. Comprehensive Bitcoin analysis dives deep into the technical and fundamental aspects of BTC, exploring the intricacies of the underlying blockchain technology, Bitcoin mining mechanisms, and the potential impact of new layers and upgrades. This in-depth examination equips readers with a profound understanding of the forces shaping the diverse Bitcoin ecosystem.
Beyond BTC news, cryptocurrency news encompasses a vast array of altcoins, decentralized finance (DeFi) projects, and other emerging technologies like AI that could potentially disrupt various industries. NewsBTC is dedicated to the most accurate crypto market news and offers a window into these important developments, partnerships, and innovations, allowing readers to stay ahead of the curve.
Cryptocurrency analysis additionally complements reading crypto news, providing thorough examinations of market trends, regulatory landscapes, and the underlying technologies propelling this rapidly advancing space. From evaluating the feasibility of new projects to assessing the potential impact of government policies, crypto analysis equips investors and enthusiasts with the knowledge necessary to navigate the complexities of the crypto world with confidence.
Moreover, crypto market news encompasses a broad spectrum of topics, including regulatory updates, institutional adoption, and the integration of cryptocurrencies into various sectors. As more countries explore central bank digital currencies (CBDCs) and businesses embrace crypto payments, staying informed about these developments becomes crucial for understanding the broader implications and potential opportunities.
NewsBTC’s commitment to delivering the latest Bitcoin news, cryptocurrency news, and crypto market news extends beyond merely reporting on events. The platform’s team of experienced journalists and analysts delve into the heart of the matter, providing insightful commentary, conducting in-depth interviews with industry leaders, and offering expert opinions on the future of the cryptocurrency space. This comprehensive approach ensures that readers receive a well-rounded understanding of the complex and ever-evolving world of cryptocurrencies.
Furthermore, NewsBTC recognizes the importance of timely and accurate information in the fast-paced crypto market. As such, the platform employs cutting-edge technology to deliver real-time updates, breaking news alerts, and price tracking tools, empowering readers to make informed decisions based on the most current data available. This dedication to promptness and precision sets NewsBTC apart as a trusted source for cryptocurrency enthusiasts, traders, and investors worldwide.
In addition to its news coverage, NewsBTC also serves as an educational resource for those new to the world of cryptocurrencies. The platform offers beginner-friendly guides, tutorials, and explanatory articles that demystify complex concepts and help readers understand the fundamentals of blockchain technology, cryptocurrency wallets, and trading strategies. By fostering a knowledgeable community, NewsBTC contributes to the growth and mainstream adoption of cryptocurrencies.
Ultimately, cryptocurrency market news plays a pivotal role in helping investors identify potential investment opportunities and manage their portfolios effectively. By staying on top of the latest cryptonews, investors can gain valuable insights into emerging trends, new projects, and overall market sentiment, enabling them to make well-informed decisions that align with their investment goals and risk tolerance. As the go-to source for Bitcoin news, cryptocurrency news, and crypto market analysis, NewsBTC remains committed to empowering its readers with the knowledge and tools necessary to navigate the exciting and transformative world of digital assets.
NewsBTC is a cryptocurrency news service that covers bitcoin news today, technical analysis & forecasts for bitcoin price and other altcoins. Here at NewsBTC, we are dedicated to enlightening everyone about bitcoin and other cryptocurrencies.
We cover BTC news related to bitcoin exchanges, bitcoin mining and price forecasts for various cryptocurrencies.
© 2024 NewsBTC. All Rights Reserved.